Creating Grafana Annotations with InfluxDb
Published: August 8, 2016
When reviewing historical data in tools such as InfluxDb, it’s typically useful to overlay a timeline of key events. For example, Google Analytics features a simple GUI for adding annotations and New Relic offers an API for marking deployments. In this post we’ll look at creating annotations for your InfluxDb powered Grafana visualizations.
Composition of an annotation
As shown in the official Grafana documentation for annotations with InfluxDb, an annotation is composed of up to 3 pieces of data…
- Title
- Tags
- Text
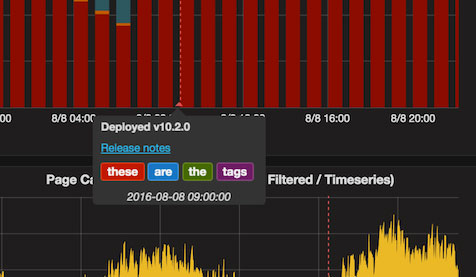
Grafana hasn’t provided any official recommendation on how to use these three fields (that I can find), but in the screenshot below…
- “Deployed v10.2.0” is the “Title”
- “Release notes” is the “Text”
- “these” “are” “the” “tags” are the “Tags”
From my research it seems that…
- The title is typically used to provide a heading for the event
- The text provides additional information. Linking to release notes is good use case
- I’m not sure what tags are meant to be used for. Perhaps to allow filtering of annotations on a dashboard for certain tags, although I haven’t seen that documented anywhere.
Writing to data to InfluxDb
Grafana expects that each of the pieces of data will come from a field not a tag.
The InfluxDb query to create the annotation from the screenshot above looks like this.
$ curl -X POST "http://localhost:8086/write?db=mydb&precision=s" --data-binary 'events title="Deployed v10.2.0",text="<a href='https://github.com'>Release notes</a>",tags="these,are,the,tags" 1470661200'
As you can see…
- Grafana will let you send HTML in the “Text” such as a link to the release notes
- The tags are separated by commas
Pulling the data into Grafana
The annotation can be pulled into Grafana as follows…
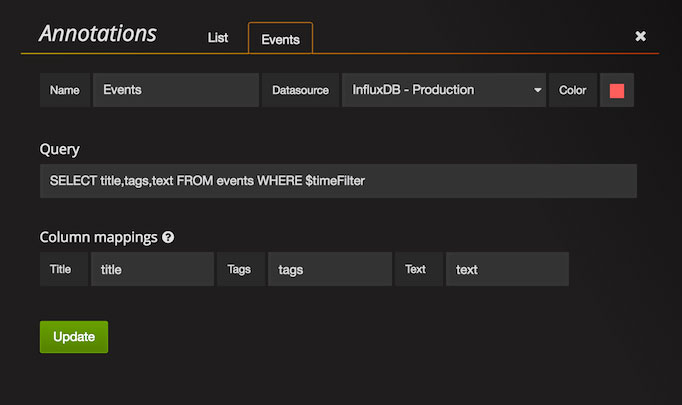
Per the Grafana docs, if you only select one field you don’t need to fill out the Column mappings and that field will automatically be pulled in as the title
Limitations
Annotations are created on a per dashboard basis….
- They can’t apply to a single graph
- They can’t apply to a single panel
- They can’t apply across multiple dashboards
Conclusion
When I was first reading on annotations I found that a lot of information was missing from the Grafana annotation docs, so I’m hoping this will help a few people. Feel free to use the comments section below or hit me up on Twitter if you have comments or questions.
 Hi, I'm Max!