Visualizing sar data with kSar
Published: September 13, 2018
sar is a useful tool that is included in the sysstat package, a set of performance monitoring utilities that is pre-installed on many Linux distros.
Running the sar command prints the gathered data to the terminal in columns.
$ sar 2 10
Linux 4.14.62-v7+ (pluto) 	09/13/2018 	_armv7l_	(4 CPU)

08:48:05 PM     CPU     %user     %nice   %system   %iowait    %steal     %idle
08:48:07 PM     all      0.13      0.00      0.00      0.00      0.00     99.87
08:48:09 PM     all      0.00      0.00      0.13      0.13      0.00     99.75
08:48:11 PM     all      0.38      0.00      0.00      0.00      0.00     99.62
08:48:13 PM     all      0.13      0.00      0.13      0.00      0.00     99.75
08:48:15 PM     all      0.13      0.00      0.13      0.00      0.00     99.75
08:48:17 PM     all      0.00      0.00      0.25      0.00      0.00     99.75
08:48:19 PM     all      0.00      0.00      0.38      0.00      0.00     99.62
08:48:21 PM     all      0.00      0.00      0.13      0.00      0.00     99.87
08:48:23 PM     all      0.00      0.00      0.38      0.00      0.00     99.62
08:48:25 PM     all      0.00      0.00      0.00      0.00      0.00    100.00
Average:        all      0.08      0.00      0.15      0.01      0.00     99.76
This is useful in some scenarios such as checking CPU usage at a specific period of time. However, in other use cases such as reviewing trends over a longer period of time, this format is not particularly user friendly.
I spent some time recently reviewing the available options for visualizing sar data. While kSar doesn’t offer the most beautiful interface1, it’s easy to install and seems to be the best option available
Here I’ll cover how kSar can be used to visualize sar data.
Installation
kSar is distributed as a jar file. You can download the latest version from the kSar GitHub releases page.
Once downloaded, you can start it at the command line
$ java -jar ksar-5.2.3-all.jar
Usage
kSar can visualize sar data loaded from a file, loaded from a local command or loaded from an SSH command.
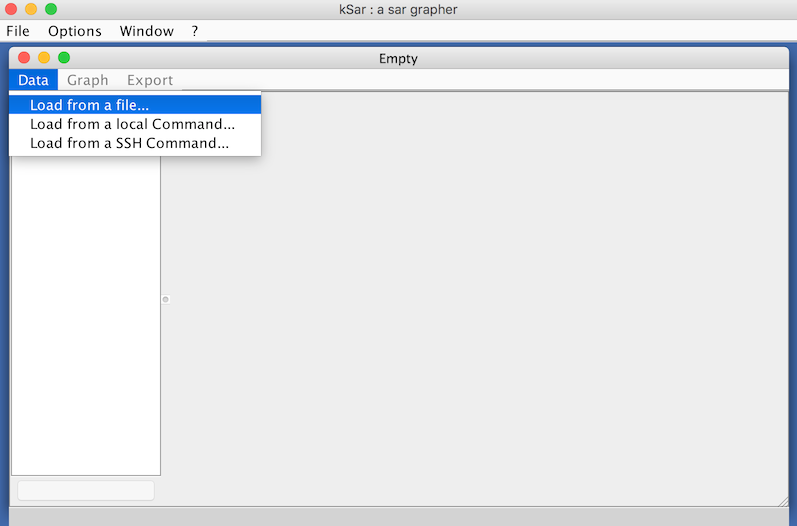
In my usage, I’ve always used the “Load from a file” option.
For example in order to analyze all the data in the file /var/log/sa/sa13 you can run the following…
$ LC_ALL=C sar -A -f /var/log/sa/sa13 > ~/sar.txt
sar.txt can then be loaded into kSar
You can also concatenate multiple files together before loading into kSar…
$ LC_ALL=C sar -A -f /var/log/sa/sa12 > ~/sar.txt
$ LC_ALL=C sar -A -f /var/log/sa/sa13 >> ~/sar.txt
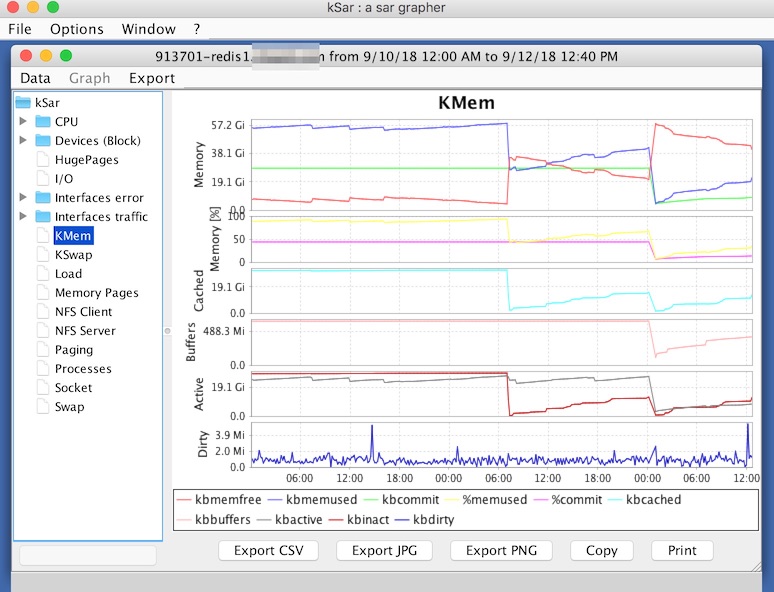
Once you have the data loaded you can use the sidebar menu to choose the data you’d like to visualize. Here’s an example visualization of memory usage on a server running Redis…
Footnotes
1 . Part of me want’s to write my own sar visualizer. I would write something that runs in the browser and leverages a modern JavaScript data visualization library, likely packaged as a single binary written in Go…↩
 Hi, I'm Max!