Interpreting Traceroute Results
Published: November 19, 2016
After reading through the beginning of Andrew Blum’s, Tubes last night, I decided to spend some time today playing with traceroute. I was initially exposed to the tool via Pingdom’s root cause analysis feature, which captures a traceroute when it detects a downtime incident for diagnostic purposes. In the past, I’ve always been a bit confused about how to actually interpret the traceroute results. But, as of today, I feel pretty good about my understanding. In this post, I’ll share what I’ve learned for anyone else struggling to make sense of traceroute.
What Is traceroute For?
The goal of traceroute is to…
- Track the path taken on the network to reach a given host.
- Record the time it takes to get to each “hop” along the way.
If you have a website that’s down or slow, traceroute is a useful tool for diagnosing if the issue is network related.
How Does traceroute Work?
traceroute takes advantage of the TTL field found in IP packets. If you’re like me, you think of “TTL” as an indicator for cache expiry such as with DNS. However, with IP packets, TTL refers to the maximum number of “hops” a packet can take on it’s way to the requested host.
Each gateway on the network that processes the packet reduces the TTL value by 1. Once the TTL has been decremented to 0, the link that terminates the connection (usually) sends an ICMP TIME_EXCEEDED response. Traceroute sends out a sequence of packets (typically UDP) increasing the TTL each time and measuring the response time until it reaches the intended host.
Why Does The Time Go Down Between Hops?
One thing that always confused me in the past looking at traceroute results was seeing the time go down between hops.
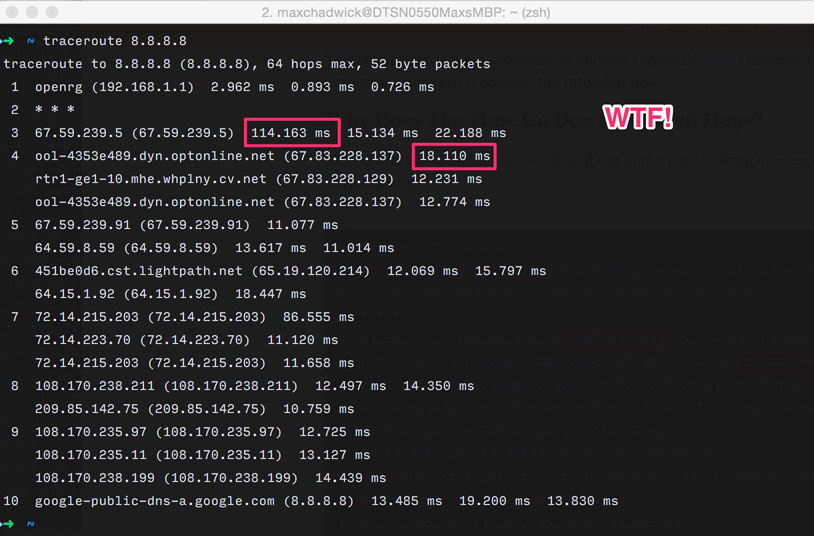
The key to understanding why this happens is that, as stated above, traceroute sends a separate request for each hop on the way to the destination. In other words, in the screenshot above, the request that took 114.163 ms to reach the 3rd hop has nothing to do with the request that took 18.110ms to reach the 4th hop. Due to constantly varying network conditions it is entirely possible for time to go down from earlier to later hops. This is definitely a source of confusion as evidenced by this Stack Overflow thread.
What Do The Asterisks Mean?
The asterisks mean ICMP TIME_EXCEEDED response was not received within the allowed wait time. Wait time for traceroute defaults to 5 seconds, but can be modified by supplying the -w flag when running the command.
It is not uncommon to see hops with asterisks in the middle of a traceroute as there are many gateways that simply don’t return the ICMP TIME_EXCEEDED response.
Why Did traceroute Never Reach The Host?
Sometimes, traceroute just ends with asterisks over and over. You’ll see something like this…
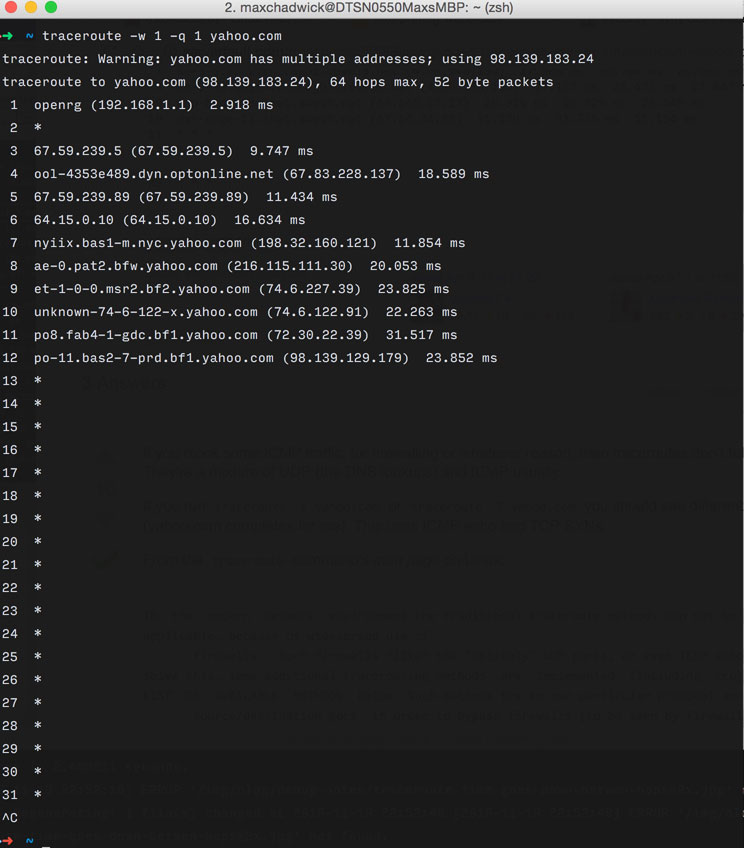
In this case, a firewall is likely blocking the UDP packets traceroute is sending. traceroute offers the -P flag for using the TCP or ICMP protocol and the -p flag for specifying the port. In some cases, I’ve also observed that tcptraceroute is more successful at getting through firewalls.
Number of Queries
You may have noticed the -q flag in the screenshot above. By setting -q 1 I am telling traceroute to only trace the route to the host once. By default it will do it 3 times. The idea behind defaulting to 3 is that it can be averaged to filter out any network anomalies.
Multiple IPs on a single hop
Again, each line and each query is a unique request and there is no guarantee that the request to the host will take the exact same path to through the network. If you see multiple lines for a single hop it means there was some variance in the path taken to reach the host.
Conclusion
I hope that this article was helpful to for understanding traceroute results. If you have any comments, feel free to drop a note comments below. Of course, as always, you can reach me on Twitter as well.
 Hi, I'm Max!