Monitoring the Magento Cron with InfluxDb
Published: July 12, 2016
The Magento cron has a nasty habit of getting stuck. Ideally this wouldn’t happen, but it’s a fact of life.
Ultimately, if you have a site where cron is getting stuck frequently you’re going to want to spend some time diagnosing the root cause. That being said, in all cases, it’s probably a good idea to have something in place that will tell you if and when the Magento cron gets stuck…even on sites where it has never happened to you before.
We’ve implemented a good system for doing this at Something Digital. We’re using two tools from the “TICK” stack - InfluxDb, a time-series database which we use to store data from cron_schedule, and Kapacitor, an agent that runs alongside InfluxDb and can stream or batch query data and react to it (e.g. send alerts). In this post I’ll outline our set up.
NOTE: Magento 2 has significantly improved reliability of cron through new features such as groups (which are actually available in Magento 1 if you use Aoe_Scheduler) and the ability to parallelize jobs with the use_separate_process setting. That being said, cron is always mission critical and there's never a case where you shouldn't be monitoring it.
The Cron Monitoring Dilemma
Before getting into the details of our implementation, I’d like to discuss something I’m calling “The Cron Monitoring Dilemma”. Namely, since we’re looking to monitor the Magento cron, whatever system we put in place definitely can’t rely on the Magento cron running.

I’ve seen some pretty hacky workarounds for this. Probably the worst was an observer on admin login that checks if crons are stuck (haven’t run in the last X days) and sends an email if so. Yuck! There’s got to be a better way…
TICK Stack To The Rescue!
Our implementation leverages InfluxDb and Telegraf, moving the responsibility of tracking and alerting off Magento and onto tools that are better suited for the job. We periodically send metrics from Magento to InfluxDb which stores them in time series. Kapacitor simultaneously processes the data and alerts when needed. We do use cron for pushing measurements from Magento to InfluxDb, but we create a separate entry in crontab which will continue to execute, even if the Magento cron gets stuck. Let’s take a closer look.
Setting Up InfluxDb
The TICK stack is very easy to set up. First follow the installation instructions for InfluxDb here. On my Mac I have it installed through Homebrew, but I’ve also yum installed the rpm on CentOS boxes. On my Mac I launch it with the following command…
$ influxd -config /usr/local/etc/influxdb.conf
Once you’ve started the service you can navigate to localhost:8083 to see the admin panel.
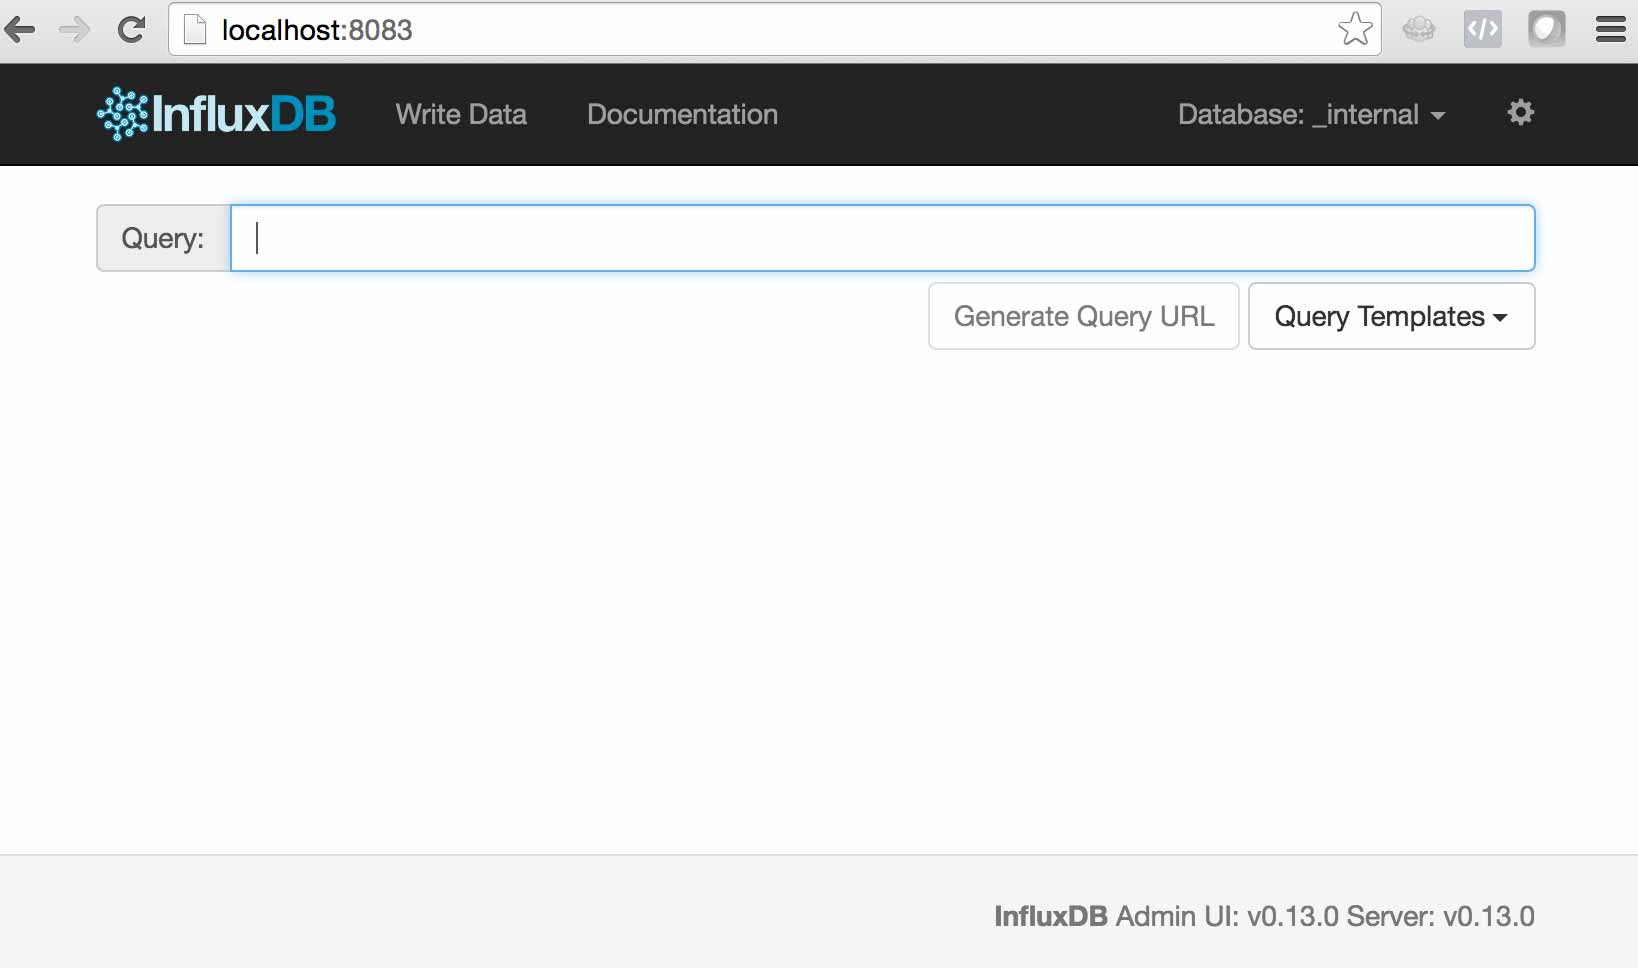
InfluxDb is similar in many ways to MySQL, but there are a few things you’ll want to understand.
-
DATABASESin InfluxDb are similar concept toDATABASESin MySQL -
MEASUREMENTSin InfluxDb are similar toTABLESin MySQL -
FIELDSandTAGSin InfluxDb are similar toCOLUMNSin MySQL. Tags are like indexed columns, but you need to be careful with the cardinality of the data you store as tags because each unique tag combination is tracked as a separateSERIESin InfluxDb and the number of unique series can quickly become a bottleneck. There are some good guidelines on number of series and the required hardware for an InfluxDb instance here. As you can see > 10 million unique series and you’re in “Probably infeasible” territory. IP address is a good example of a dimension you don’t want to store in a tag.
OK, now that we had a quick primer on the terminology, let’s create a database to push our metrics to.
CREATE DATABASE magento;
Now if you run SHOW DATABASES you should see the new magento database.
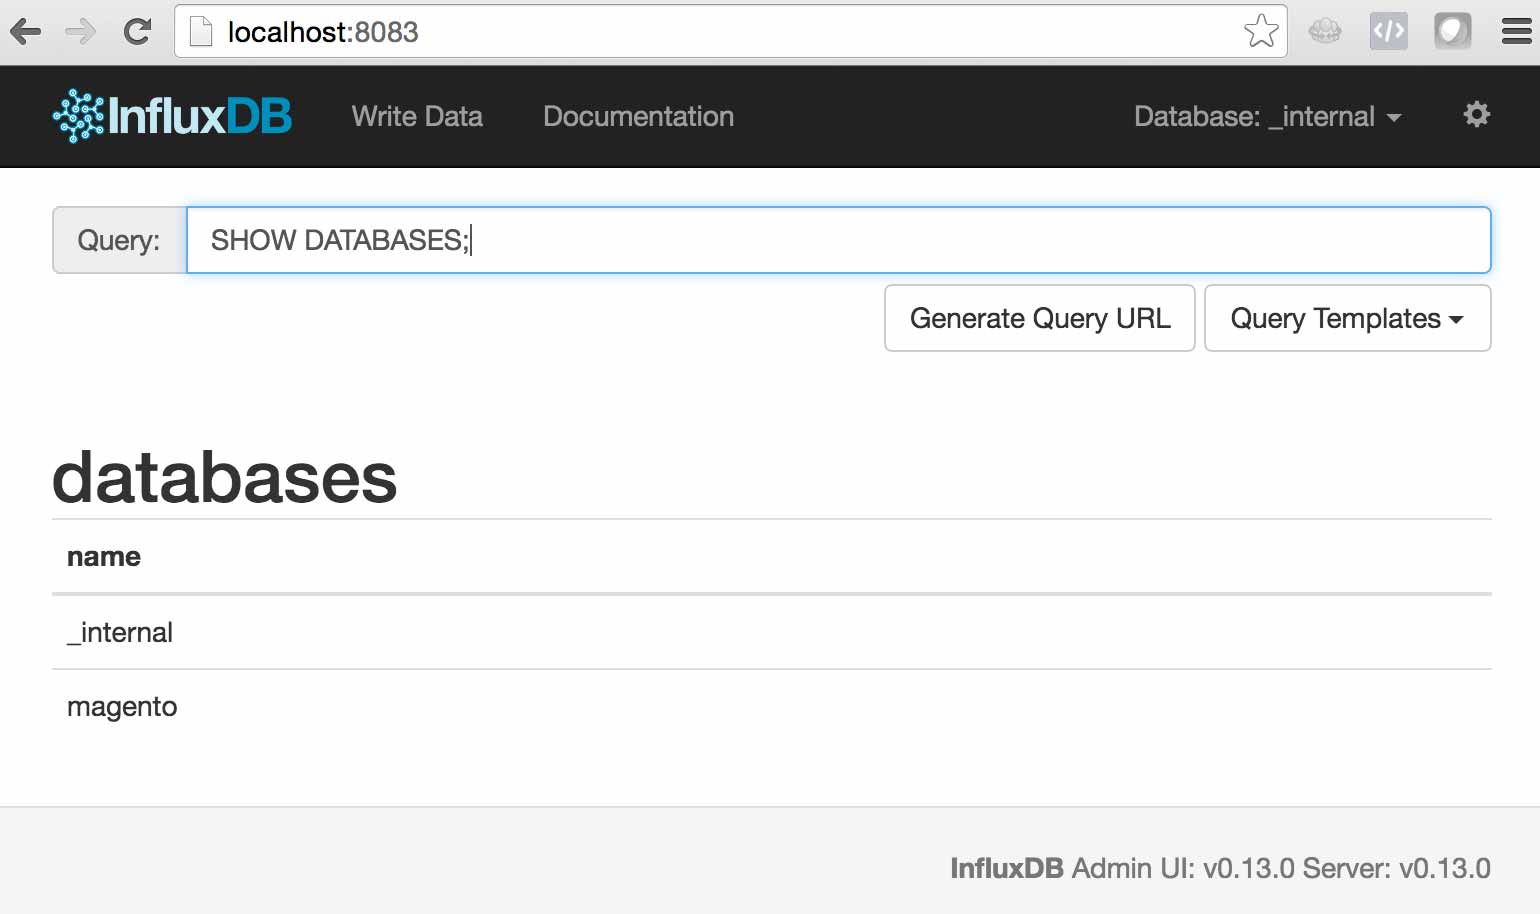
Great! That’s all we need to do with InfluxDb for now.
Pushing measurements with SomethingDigital_InfluxDb
We built a module at Something Digital which we’ve published to GitHub here. It tracks more than just cron, but we won’t focus on that in this post.
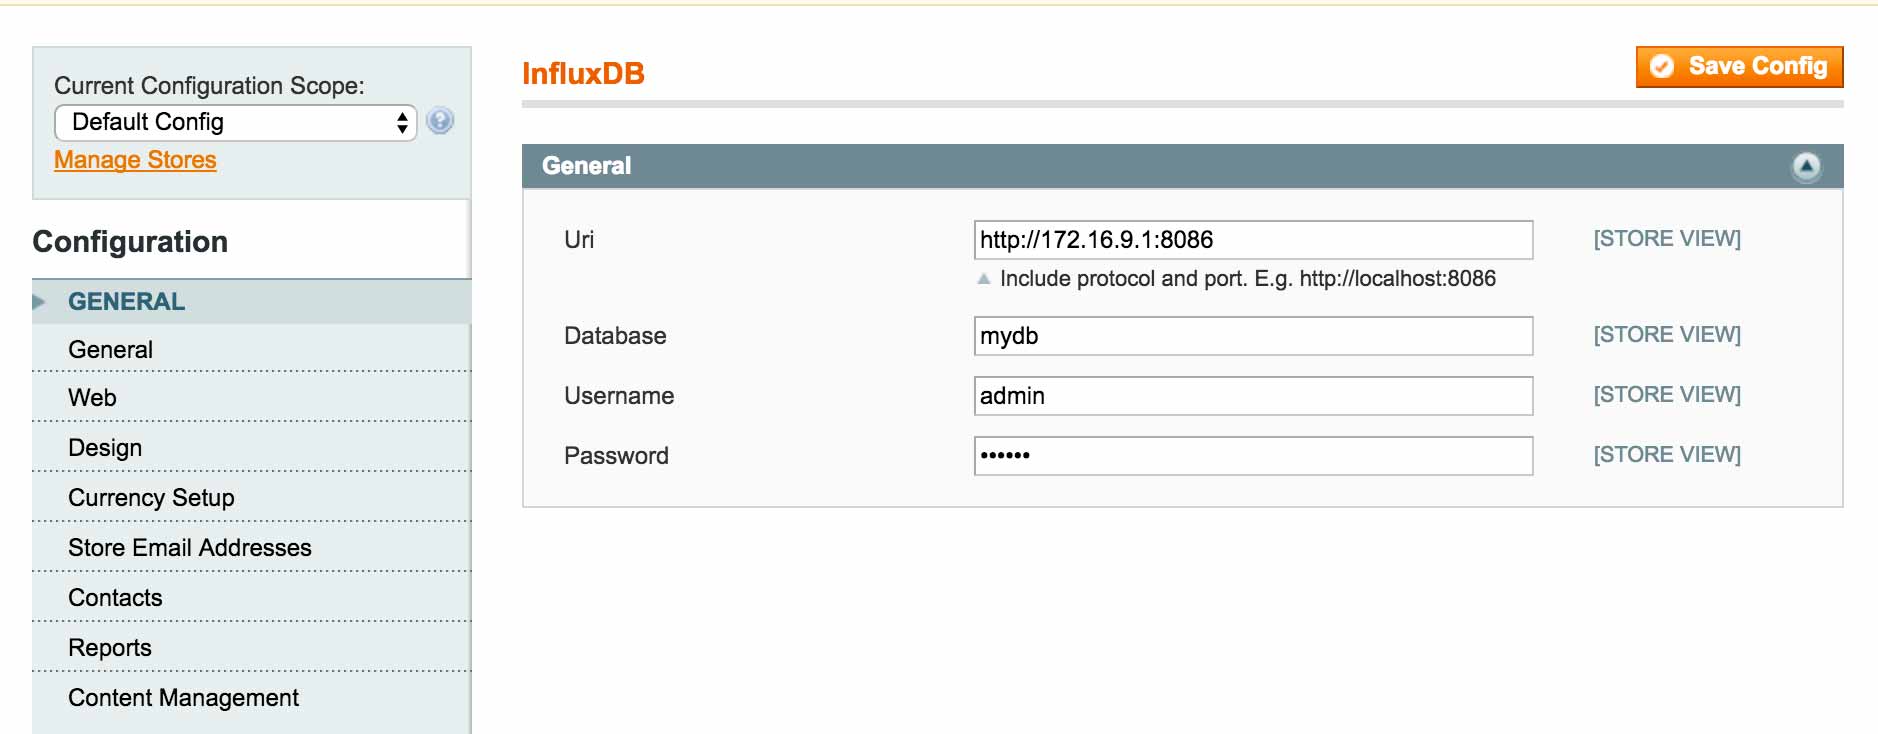
Install the module on a working 1.X installation. Then head to System > Configuration > Advanced > InfluxDb to configure the connection. In the screenshot below my Magento installation is running on a CentOS VM whereas InfluxDb is running on my Macbook. Additionally, I have authentication and authorization configured.
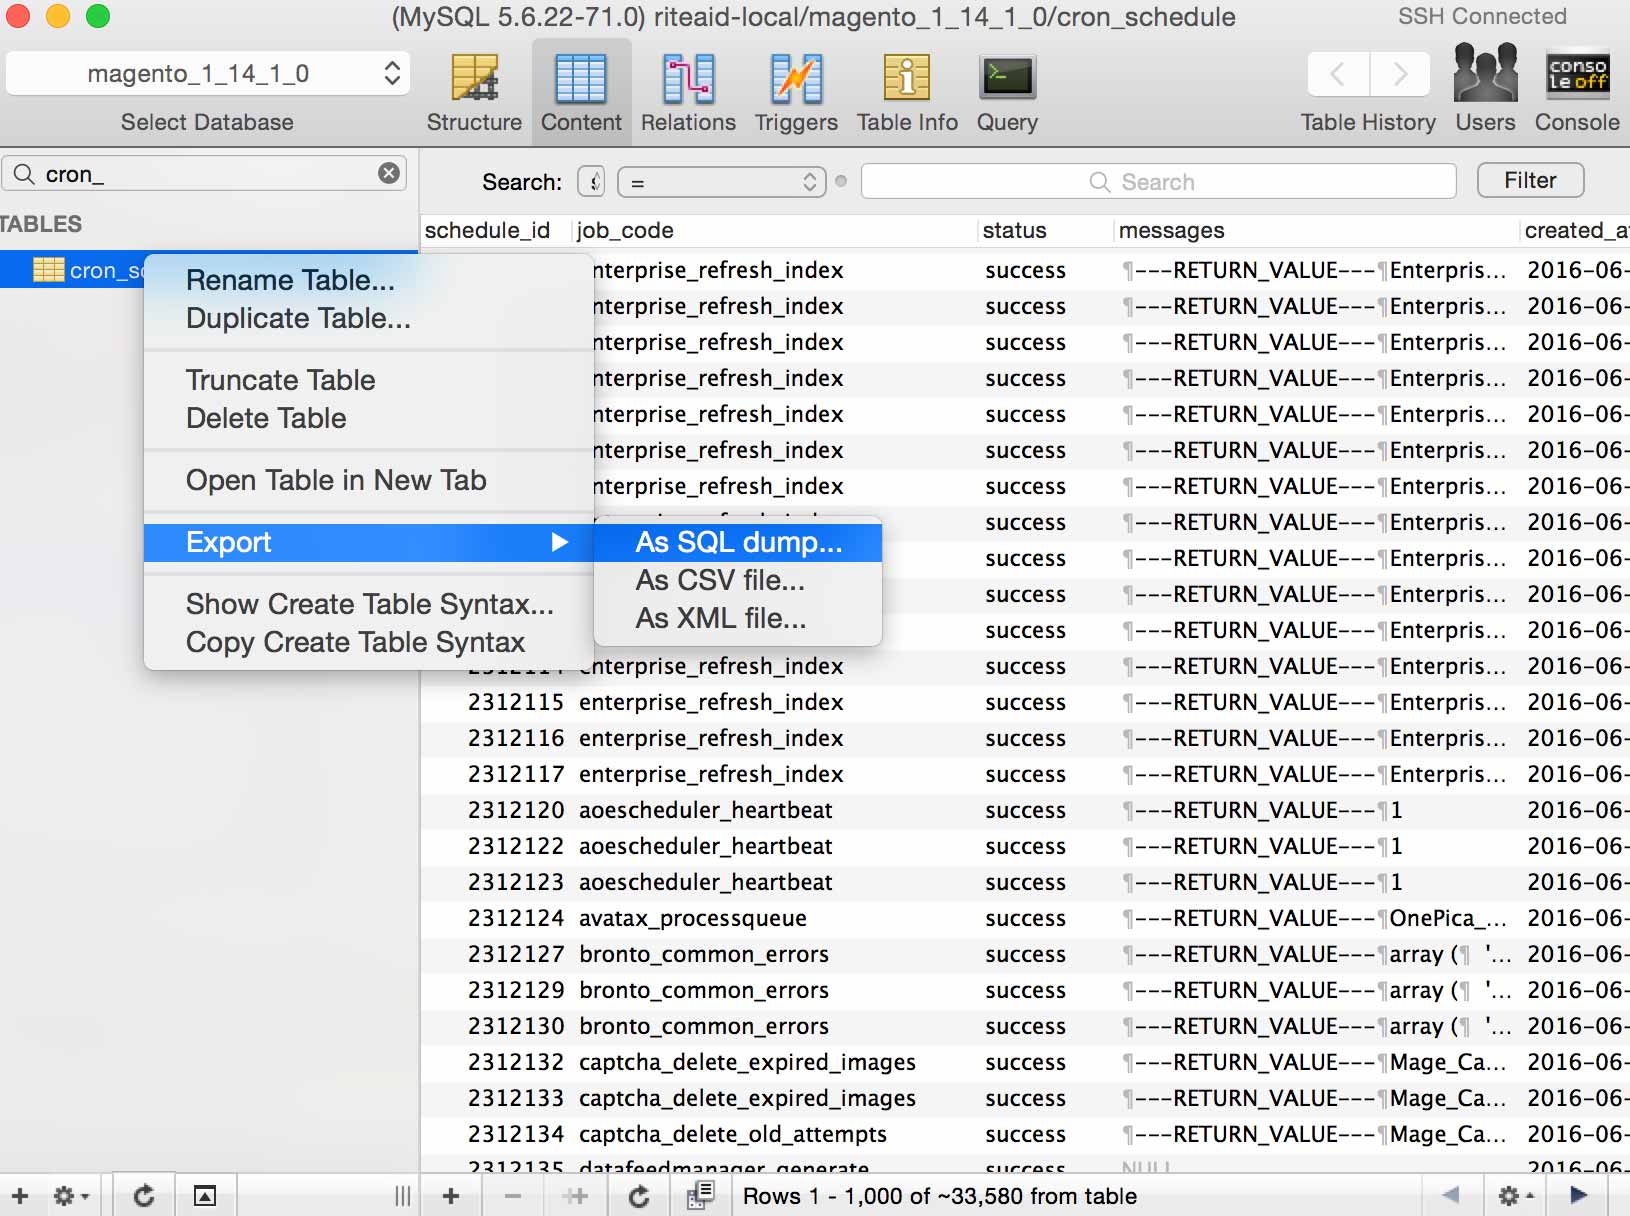
You’ll also want some sample data in cron_schedule. If possible, the easiest thing to do is just to grab an export of the cron_schedule table from a site that’s been running cron for a while (production or staging, if you’re running cron there). I love using Sequel Pro for things like this…
Then you’ll need to register a new group in local.xml. Let’s say you wanted to snapshot every 15 minutes, you’d put the following in app/etc/local.xml…
<config>
    <sd_influxdb>
        <groups>
            <fifteen_minutes>
                <cron>sd_influxdb/measurement_cron</cron>
            </fifteen_minutes>
        </groups>
    </sd_influxdb>
</config>
Then you’d add a crontab entry to execute this group every 15 minutes
*/15 * * * * /usr/bin/php /var/www/html/shell/sd_influxdb.php --group fifteen_minutes
For now, though, we’ll just execute the job ourselves.
$ /usr/bin/php /var/www/html/shell/sd_influxdb.php --group fifteen_minutes
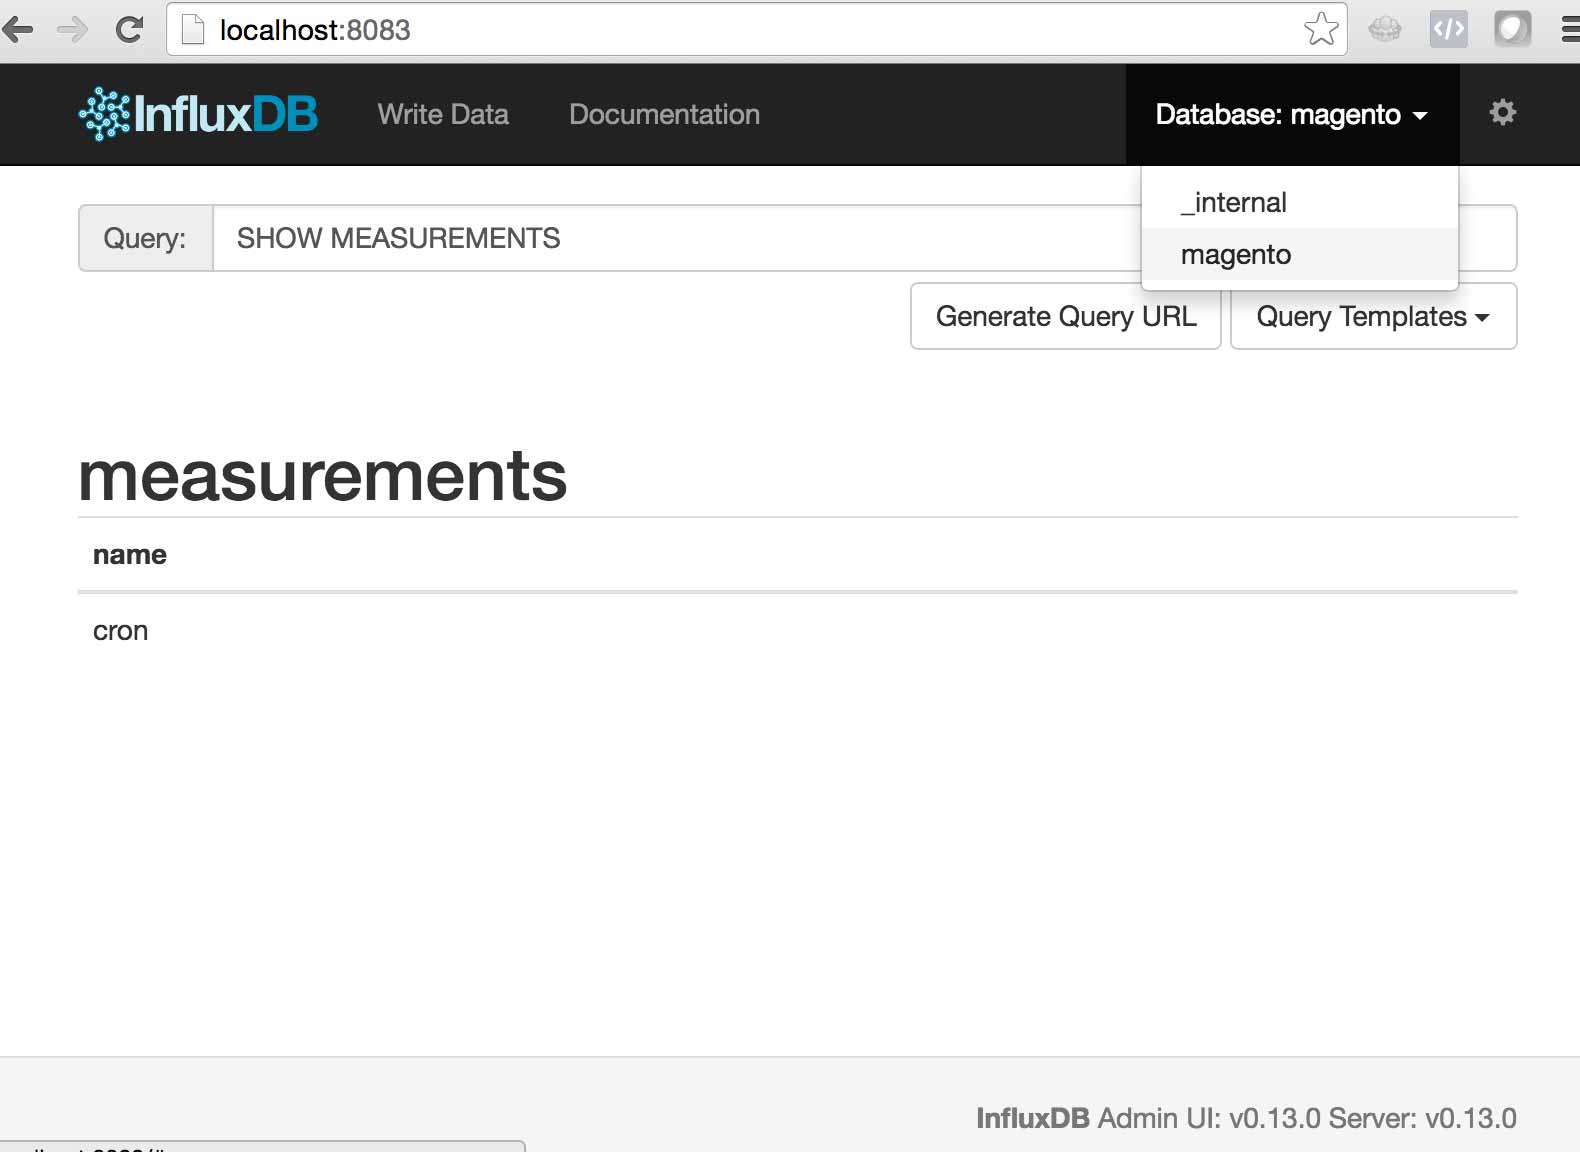
Now go back to the InfluxDb and select “Magento” as the DB in the upper right hand corner and run SHOW MEASUREMENTS and you should see the cron measurement.
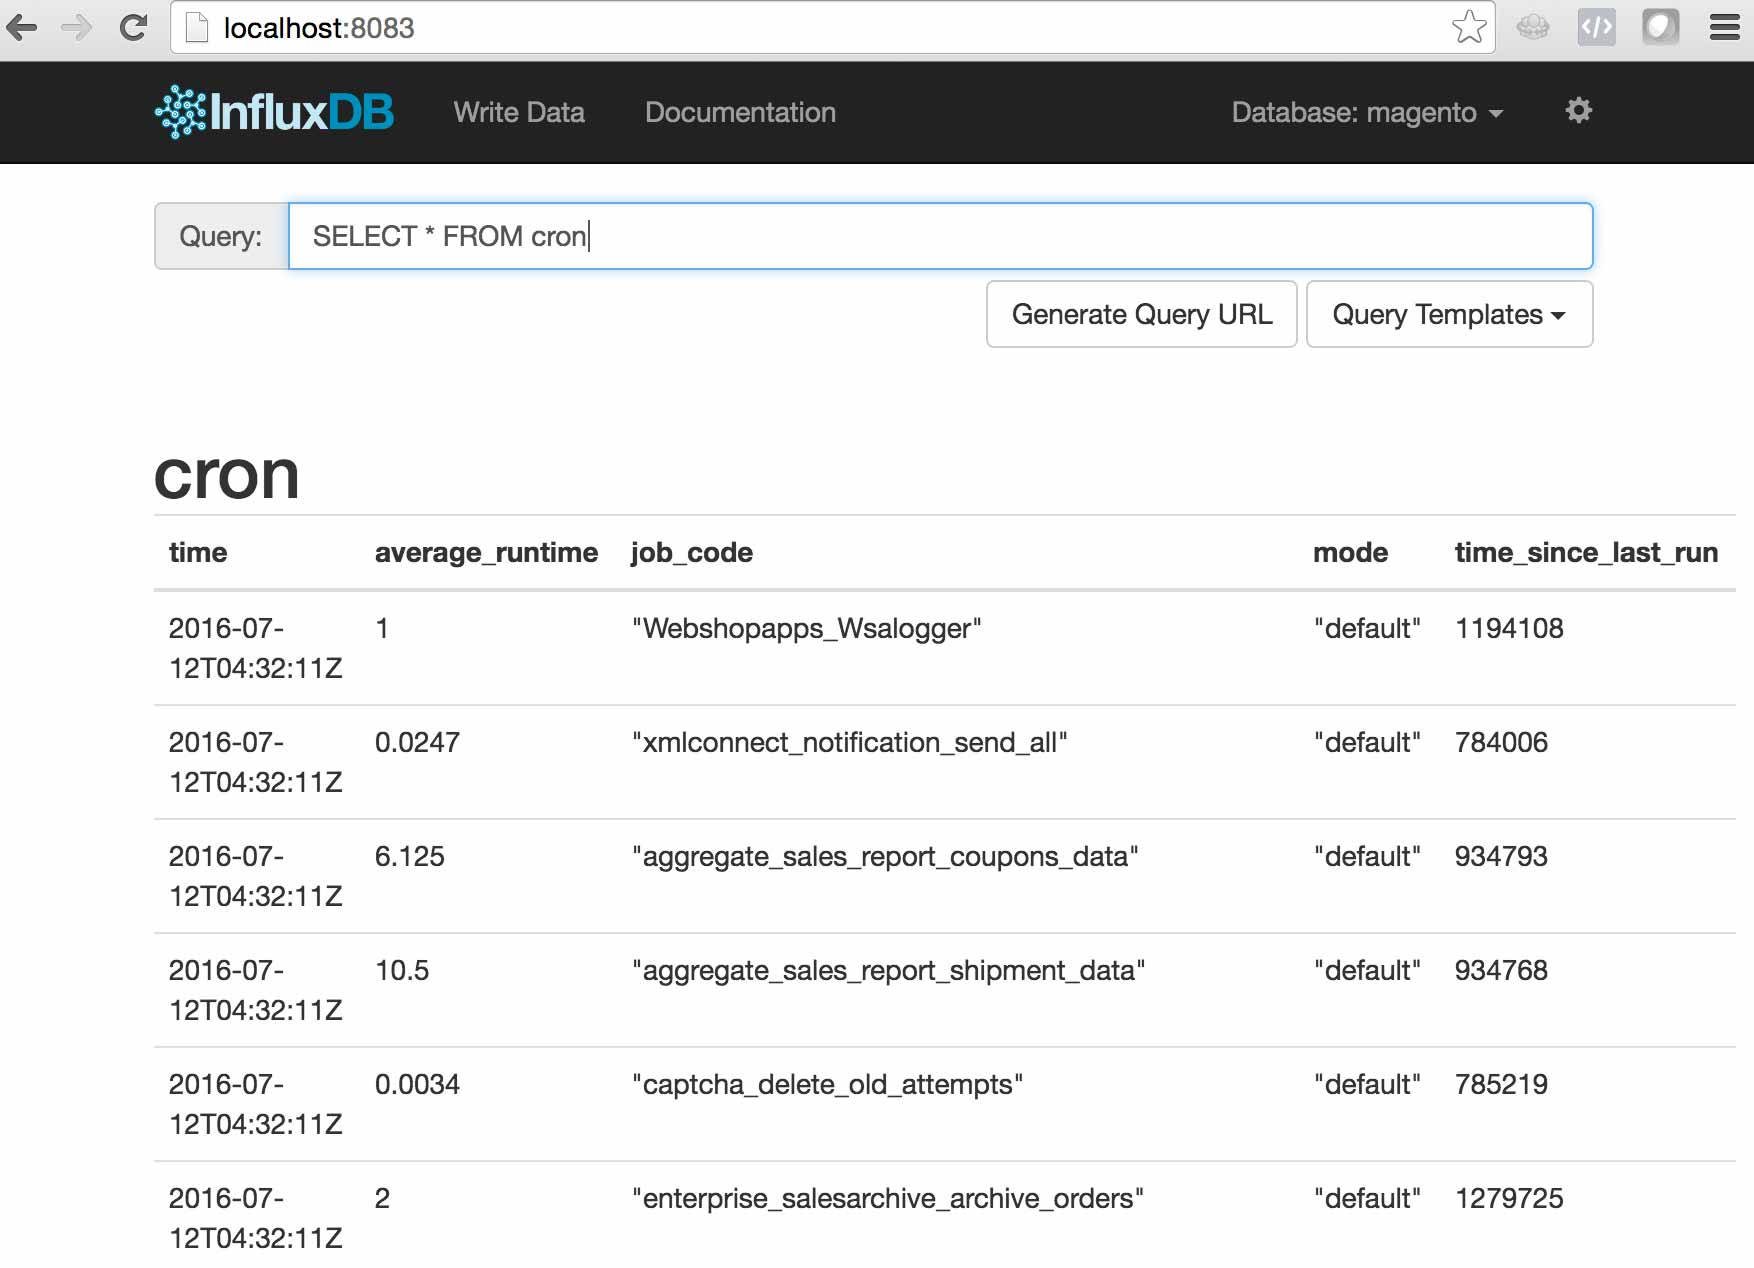
SELECT * FROM cron will show you what was pushed
Excellent! Now let’s take a look at how we can leverage Kapacitor to alert us if something goes wrong.
Alerting with Kapacitor
Kapacitor is another piece of the “TICK” stack, and it is what we will use to process the data that we push to InfluxDb and alert when needed. The first thing you’ll need to do is get Kapacitor installed. It’s just as easy as installing InfluxDb. Here are the instructions.
Once installed you’ll need to generate a configuration file. This contains things like details for the InfluxDb connection, or SMTP credentials. Once configured you can start Kapacitor. Here’s how I start the service on my Macbook.
$ kapacitord -config kapacitor.generated.conf
The main things to understand about Kapacitor are…
- Entirely CLI based…there’s no GUI.
- Everything is a task.
- It uses a DSL called “TICKScript” to process data from InfluxDb.
Here’s the TICKScript we’ll use for alerting us in case cron fails…
batch
  |query('SELECT min(time_since_last_run) FROM "magento"."default"."cron"')
    .groupBy('mode')
    .period(15m)
    .every(15m)
  |alert()
    .crit(lambda: "min" > 14400)
    .stateChangesOnly()
    .log('/tmp/cron_batch.log')
I find TICKScript to be pretty intuitive, but essentially we’re fetching the lowest time_since_last_run value for each mode (the last executed cron job) every 15 minutes. If the value is greater than 14400 (4 hours) we’re alerting. Here we’re just using a log file, but there’s a long list of ways that Kapacitor can alert including email, HipChat, Slack, and PagerDuty.
Now that we have the required TICKScript we need to define a task to use that script.
$ kapacitor define cron_alert -type batch -tick cron_alert.tick -dbrp mydb.default
Again, I find this to be pretty straight forward, but there are a couple things worth calling out…
- You’ll see the we specifiy “batch” as the type here. Kapacitor can also stream data from InfluxDb by specifying “stream” as the type.
-
dbrpis an acronym for “database / retention policy”. We are not going to cover retention policies in depth here, but suffice it so say that in combination with continuous queries, they’re one of the InfluxDb’s most powerful features.
Once you’ve defined your task you’ll see it registered via the kapacitor list tasks command…
$ kapacitor list tasks
ID                            Type      Status    Executing Databases and Retention Policies
cron_alert_batch              batch     disabled  false     ["mydb"."default"]
However, by default it’s disabled. Let’s enable it…
$ kapacitor enable cron_alert_batch
$ kapacitor list tasks
ID                            Type      Status    Executing Databases and Retention Policies
cron_alert_batch              batch     enabled   true      ["mydb"."default"]
Awesome! Cron monitoring set up is complete. The TICK stack has provided a super clean solution the “The Cron Monitoring Dilemma”, and helped us avoid a “Yo Dawg” moment..
Talk To Me
As always, I’d love to hear your thoughts on the system we’ve put in place for monitoring the Magento cron with the TICK stack. Feel free to leave a reply in the comments below, or hit me up on Twitter @maxpchadwick
 Hi, I'm Max!