Monitoring Magento FPC Hit Rate
Published: June 16, 2016
We’ve been breaking some new ground (at least from what I can see in my Google searches) at Something Digital with the work we’ve been doing to monitor, and improve, FPC hit rate using Enterprise_PageCache on our client’s sites. I’ll likely publish a few posts related to this topic, but the first thing I wanted to focus on is why, and how, you can track your FPC hit rate.
NOTE: I've published a module on Github that you can use to get started with monitoring right away. Stick with me here, though, I'll show you why this is so important.
Why Should I Track Hit Rate?
It’s no secret that the faster your site is, the more likely you are to convert visitors. FPC virtually eliminates the time it takes your server to generate and respond with an HTML document. The savings FPC yields depend on the speed of your site without FPC. A variety of factors can impact that…
- The power of your server
- Your site’s theme
- Your catalog setup
- 3rd party extensions
- Local customizations
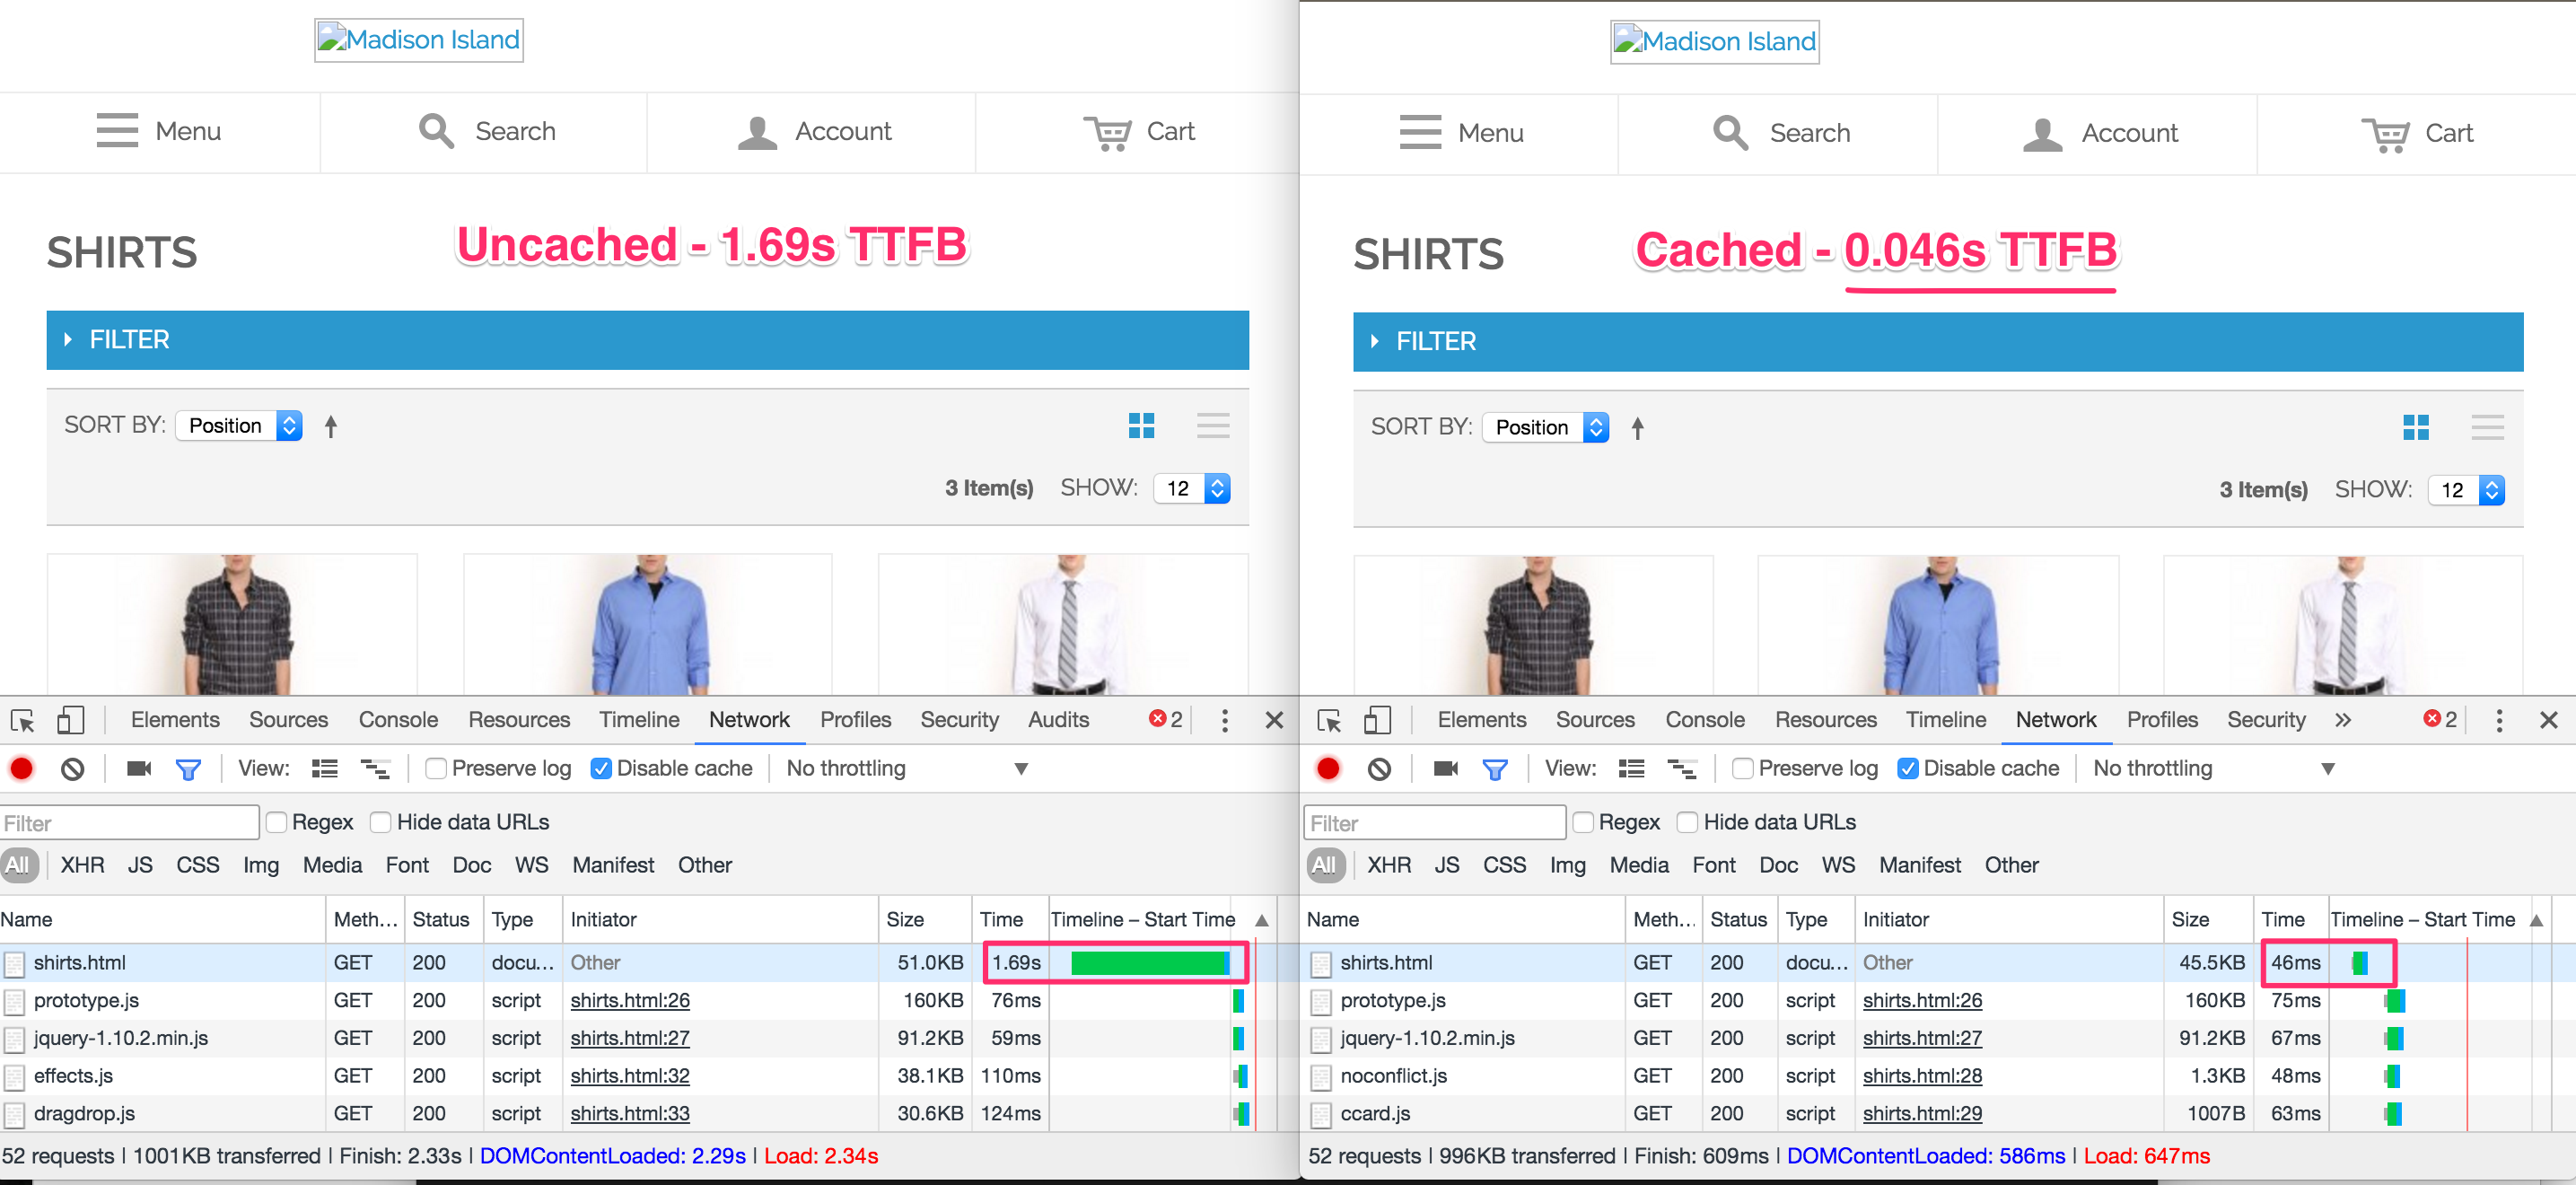
Running a Magento 1.14.1.0 installation with sample data on a CentOS VM with 2GB of RAM it took me ~1.7 seconds to load /men/shirts.html uncached. When the page was pulled from FPC the server responded with the HTML document in less than 0.05 seconds!
Clearly we want the server to respond with cached pages as often as possible, however, there are many factors that can cause that to happen less often than we might like. A full investigation of those is not the focus of this post (although it likely will be explored in more depth in a follow up post), but here are some examples.
- Requests with high query string “depth” (e.g. ad tracking parameters).
- 3rd party modules that are incompatible with, or generally reduce hit rate for FPC.
- High throughput to non-cached routes (e.g.
/catalogsearch/result/index). - Configuration of FPC settings (max depth, max cache size).
- Cache backend set up (e.g. maxmemory setting, if you’re using Redis).
- Catalog set up (number of products / categories / attributes).
Knowing and monitoring your hit rate enables the following…
- Gather benchmarks, identify and implement improvements, rinse and repeat.
- Configure alerting if FPC hit rate drops drastically (I’ve seen site outages caused by a surge of traffic which never got cached responses due to usage of utm query string parameters).
Now that I’ve sold you on why you should be monitoring FPC hit rate, let’s go into the how.
How Do We Monitor It?
As mentioned in the beginning of the post, you can just download this module. However, I’d like to spend a little time discussing how / why it works.
If you walk through Magento’s handling of a request from the beginning (index.php) it won’t be long until you get to Mage_Core_Model_App::run(). If you look at that method, you’ll see this…
<?php

if ($this->_cache->processRequest()) {
    $this->getResponse()->sendResponse();
} else {
    // Initialize the application
    // Load all the modules
    // Dispatch the request
}
The result of this if statement tells us if we have an hit. If $this->_cache->processRequest() evaluates to true, we have a full hit and the response will be sent right away.
Otherwise, we have either have a full miss or a “partial” hit.
A Partial Hit?
Yes, a partial hit. This may come as news to some of you, but FPC is not all or nothing.
A partial hit means the response was pulled from cache, however one of the following is true…
- It had containers that could not be pulled from cache
- The session info cookie couldn’t be pulled from cache.
That logic can be found in Enterprise_PageCache_Model_Processor::_processContent().
<?php

protected function _processContent($content)
{
    $containers = $this->_processContainers($content);
    $isProcessed = empty($containers);

    $sessionInfo = Enterprise_PageCache_Model_Cache::getCacheInstance()->load($this->getSessionInfoCacheId());

    if ($sessionInfo) {
        // Handle session info
    } else {
        $isProcessed = false;
    }

    if ($isProcessed) {
        return $content;
    } else {
        Mage::register('cached_page_content', $content);
        Mage::register('cached_page_containers', $containers);
        Mage::app()->getRequest()
            ->setModuleName('pagecache')
            ->setControllerName('request')
            ->setActionName('process')
            ->isStraight(true);

        return false;
    }
}
As you can see, it will only return truthy ($content) if _processContainers doesn’t send back any containers for additional processing and the result of $this->getSessionInfoCacheId can be loaded from cache.
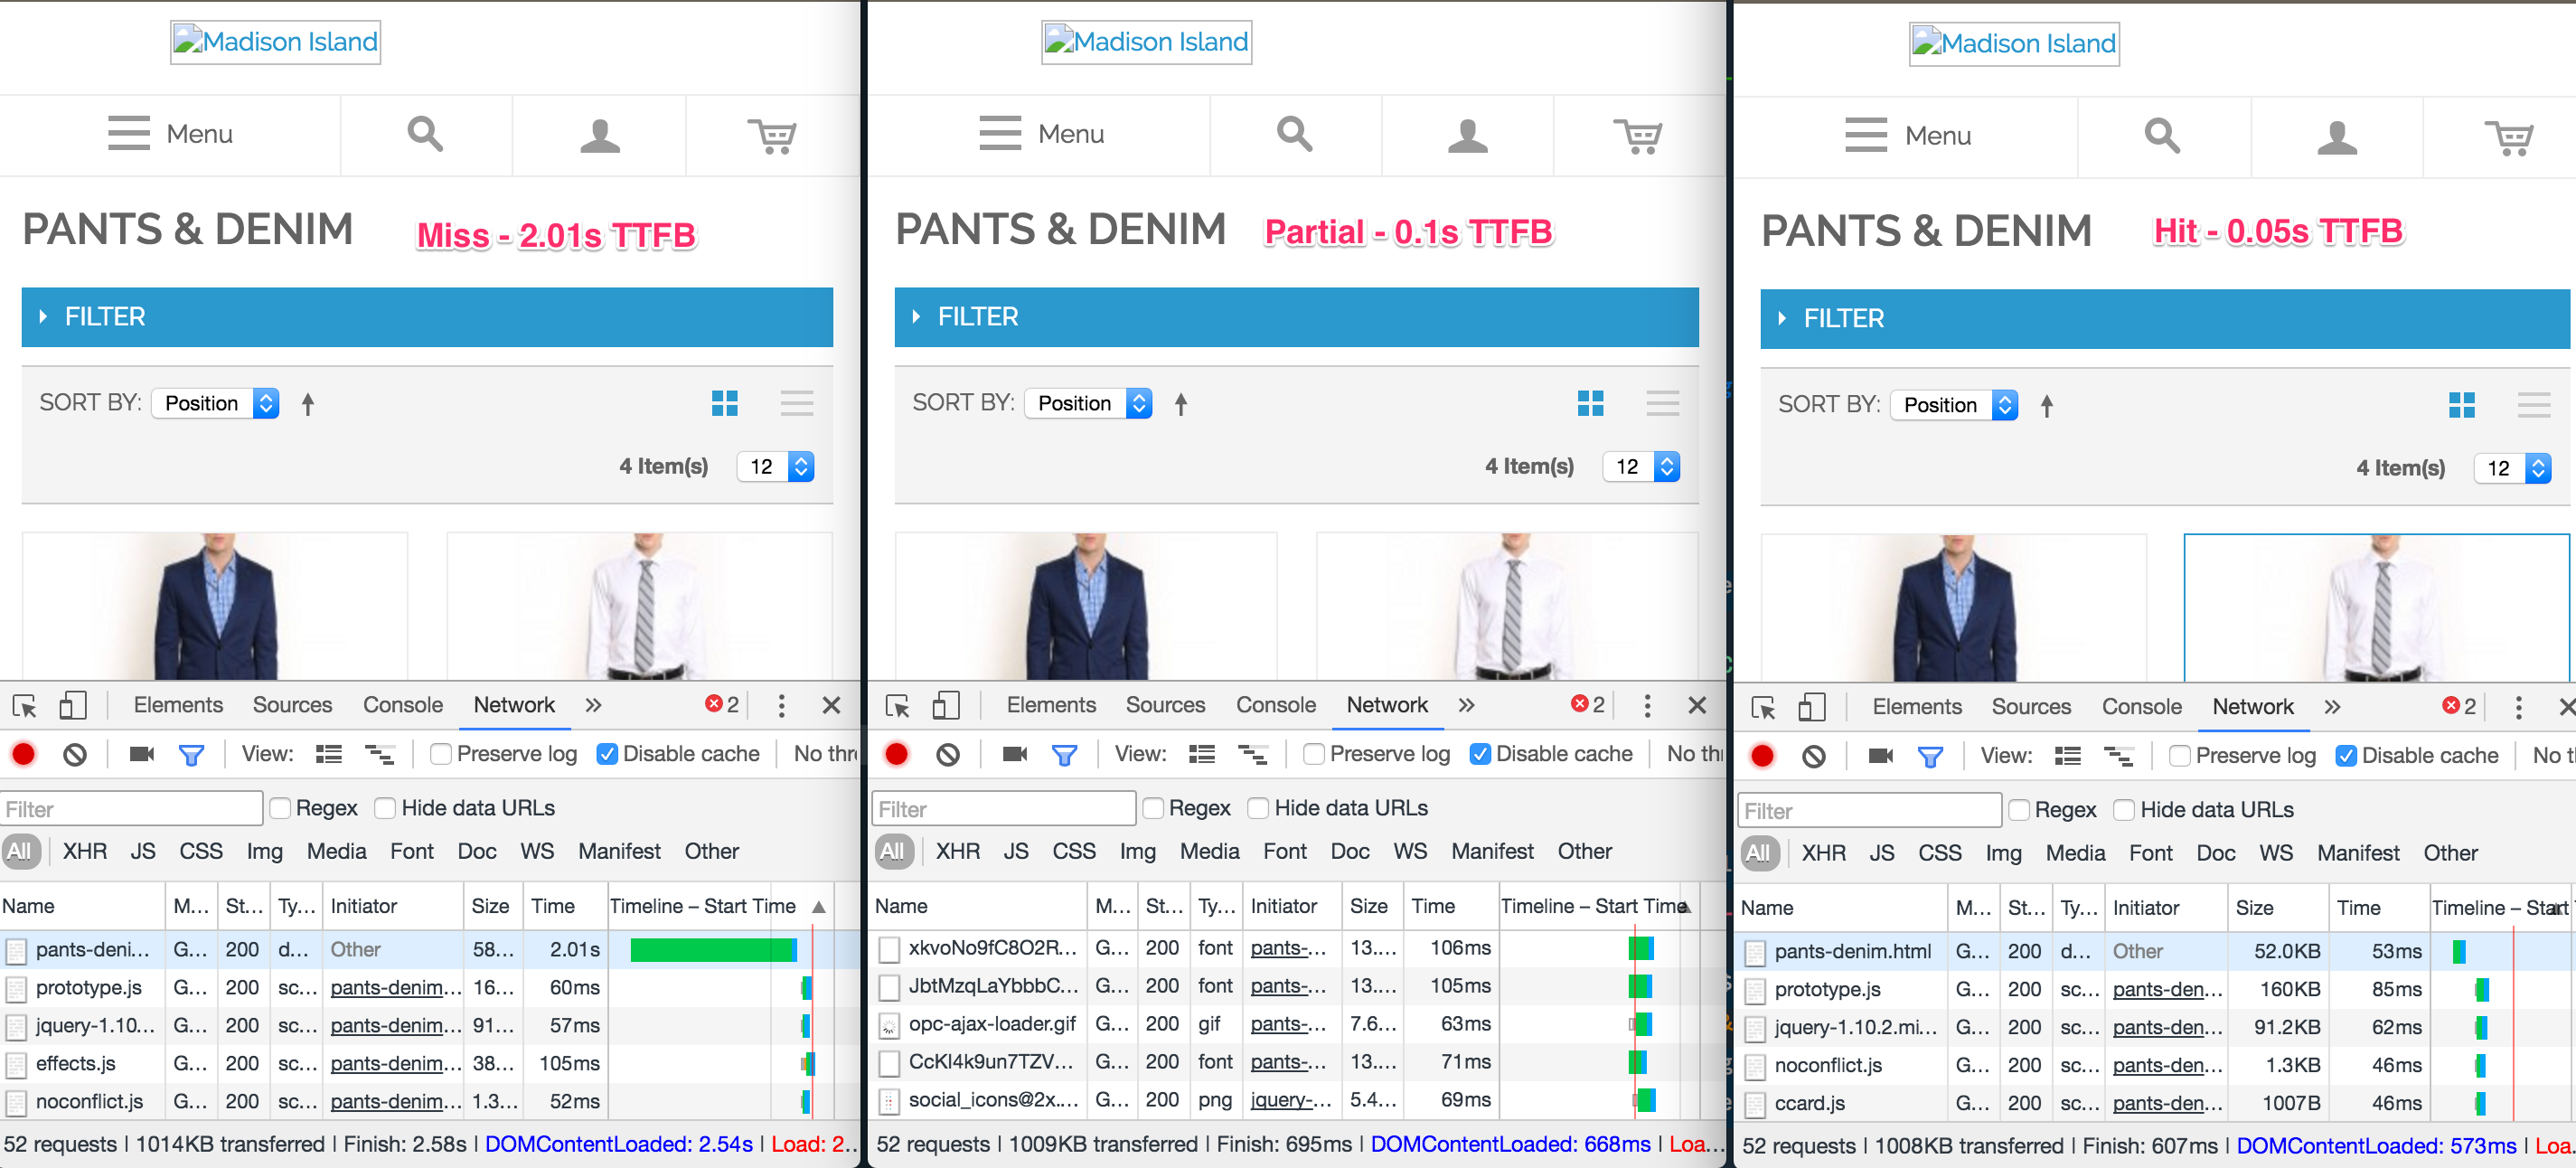
Partial hits are something to watch out for. If an extension or customization adds a block with a “no cache” container to all pages (not uncommon) you’ll wind up never getting any full hits. They’re better than misses, but not as good as full hits. The exact difference in cost will depend on how expensive the work done by the container class is. Below you can see a partial hit in the middle taking twice as long as a full hit.
That being said, 100ms for a partial hit is pretty cheap in my experience and I frequently see them taking closer to 200 - 400ms.
Using Our Own Processor To Track Hits
In order to track hits, our best option is to register our own request processor and make sure we go last. http_response_send_before will fire, don’t try to hook into it, it’s a trap. Observers haven’t been loaded this early in the execution, so even if you register an observer it won’t be executed.
Once we have our processor in place, all we have to do is evaluate $content as a boolean. If it is truthy, we have a hit!
<?php

public function extractContent($content)
{
    if (!$content) {
        // Bail, this is a miss
        return $content;
    }

    // This is a hit!
    // Track it.

    return $content;
}
Tracking Partial and Misses
For partials and misses we can take advantage of Magento’s eventing system. controller_front_send_response_before works fine here. We can check the contents of `Mage::registry('cached_page_containers')` to determine whether or not we have a hit.
NOTE: Mage::registry('cached_page_containers') is not always a safe way to check if its a miss or a partial. I plan to have this fixed in v0.2.0.
In addition, in the case of misses, it can be useful to track which container caused the miss. We can do that by getting the class of all the containers in Mage::registry('cached_page_containers').
<?php

public function trackContainerMisses($params)
{
    $containers = Mage::registry('cached_page_containers');
    foreach ($containers as $container) {
        $this->track('ContainerMiss', $params + array(
            'container' => get_class($container),
        ));
    }
}
How Should We Track?
At the time of this writing, the module includes two trackers, but was architected to allow the user to implement his or her own tracker simply by implementing the TrackerInterface and then setting that tracker in XML. Currently, the following trackers are included…
Mpchadwick_PageCacheHitRate_Model_Tracker_File
A log file will be used for tracking FPC hit rate. This is not intended for long-term production use, but can be useful for local profiling, or to get a quick snapshop of where things stand in production.
Mpchadwick_PageCacheHitRate_Model_Tracker_NewRelic
Hit rate is tracked via a New Relic custom event. New Relic is a great data store for this because it doesn’t bat an eye at extremely cardinal data. IP address is a useful dimension to when tracking hit rate as we may want to filter out Googlebot (which is much more likely to miss) to arrive at our “true” hit rate. There are a few caveats with New Relic.
- Of course, you need a paid New Relic account with New Relic insights to take advantage of this.
- Currently insights cannot be hooked up to New Relic’s alerting suite.
NOTE: I am planning to also add a tracker that stores the data in Redis. The data can the be scraped and stored in a time series database such as Prometheus or InfluxDB.
Conclusion
I hope you enjoyed learning about how and why you should be tracking your FPC hit rate here. The next logical topic is delving into some steps you can take to increase your hit rate. In the mean time, feel free to leave me a comment below or hit me up on Twitter at @maxpchadwick if there’s anything you’d like to discuss on this topic.
 Hi, I'm Max!