MySQL Query Cache Hit Rate
Published: January 22, 2017
MySQL’s query cache is a useful tool to improve performance and scalability. However, if not implemented correctly, it can do more harm than good…
The query cache offers the potential for substantial performance improvement, but do not assume that it will do so under all circumstances. With some query cache configurations or server workloads, you might actually see a performance decrease.
One critical data point to look at when measuring the effectiveness of query caching is the query cache hit rate. Let’s take a look at how to do that.
The Server Status Variables
There are three server status variables involved in calculating the query cache hit rate…
Qcache_hits
Each time a query result is returned from cache, MySQL will increment this variable. This is only maintained at a global level.
Qcache_inserts
Each time a query result is inserted into the query cache, this counter will be incremented. This is only maintained at a global level.
Com_select
Each time a query result is returned without the cache, this counter will be incremented. This is maintained at both a global and a session level. When calculating your query cache hit rate you must fetch this value at a global scope.
SHOW GLOBAL STATUS WHERE Variable_name = 'Com_select';
Two Ways To Measure
There are two ways that one can measure query cache hit rate. I would suggest monitoring both.
Hit Rate Amongst Cacheable Queries
Not all queries are cache-able. For example, queries using NOW() or CURRENT_TIME() are not cacheable. More details on which types of queries MySQL will not cache can be found here.
The formula for measuring your hit rate amongst cacheable queries is…
Qcache_hits / (Qcache_hits + Qcache_inserts)
Hit Rate Amongst All Queries
It’s also interesting to monitor your hit rate amongst all queries. In order to do so, use the following formula…
Qcache_hits / (QCache_hits + Com_select)
What’s A Good Hit Rate
Obviously, the higher the hit rate, the more likely it is that query cache is helping. Much of my work is done with Magento, which is typically greatly assisted by the query cache. In the Magento sites I looked at the hit rate was typically ~80 - 85%.
This article suggests that upwards of 50% likely means that query cache is helping. My advise would be to use look at overall application performance with any configuration changes to the query cache to understand whether or not it is helping.
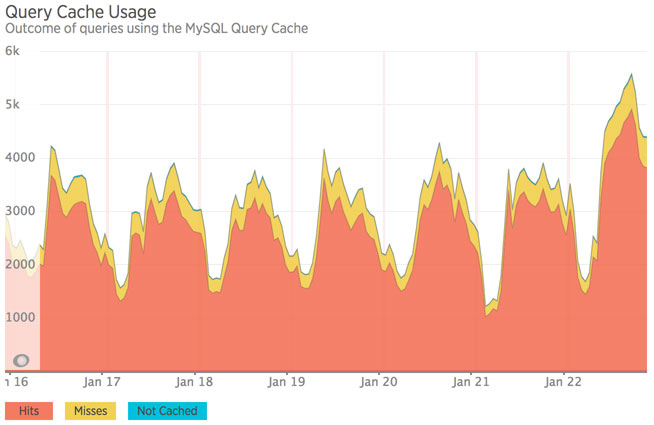
If You’re Using New Relic
I highly suggest you install the MySQL plugin. Once hooked up it will monitor your query cache hit rate over time for you.
Conclusion
If you have any questions or comments, feel free to drop a note below, or, as always, you can reach me on Twitter as well.
 Hi, I'm Max!