Profiling jekyll build with ruby‑prof
Published: October 8, 2018
As this site has grown, the time it takes for the jekyll build command to complete has continued to increase.
Currently the site has 143 posts and it takes 9.7 seconds for jekyll build to complete with a warm cache on a beefy 2014 MacBook Pro (2.2 GHz Intel Core i7, 16 GB RAM).
Recently I became interested in exploring options for speeding up the build.
Googling “jekyll build profile” lead me to jekyll build’s --profile flag.
The output looks like this:
$ bundle exec jekyll build --profile

Filename                                                                          | Count |    Bytes |  Time
----------------------------------------------------------------------------------+-------+----------+------
_layouts/main.html                                                                |   176 | 4043.23K | 1.282
_posts/2013-12-02-non-sucky-youtube-embed.html                                    |     1 |   14.00K | 0.285
_layouts/blog-single.html                                                         |   145 | 1633.02K | 0.269
sitemap.xml                                                                       |     1 |   20.50K | 0.115
tags/index.html                                                                   |     1 |   74.14K | 0.073
_includes/bio.html                                                                |   146 |  134.56K | 0.071
feed.xml                                                                          |     1 |  115.65K | 0.054
...
I didn’t find this to be particularly useful, as it gave me virtually no information on what jekyll build was actually doing that was taking so long.
Here I’ll show you how to use ruby-prof to get a more useful profile of your jekyll build.
Installation
Install ruby-prof by adding the following line to your project’s Gemfile…
gem 'ruby-prof'
Then run bundle install at the command line.
Execution
In order to execute you’ll need to find the exe/jekyll file that actually gets executed when you run bundle exec jekyll. On my system I run as follows:
$ bundle exec ruby-prof /Users/maxchadwick/.rbenv/versions/2.2.3/lib/ruby/gems/2.2.0/gems/jekyll-3.6.0/exe/jekyll build
Printers
ruby-prof provides a --printer option which can be used to obtain the output in various formats.
Personally, I find the call_stack option to be most useful (it’s very similar to what you’d see in a New Relic transaction trace, if that means anything to you).
I run it as follows…
$ bundle exec ruby-prof --printer=call_stack /Users/maxchadwick/.rbenv/versions/2.2.3/lib/ruby/gems/2.2.0/gems/jekyll-3.6.0/exe/jekyll build > call_stack.html
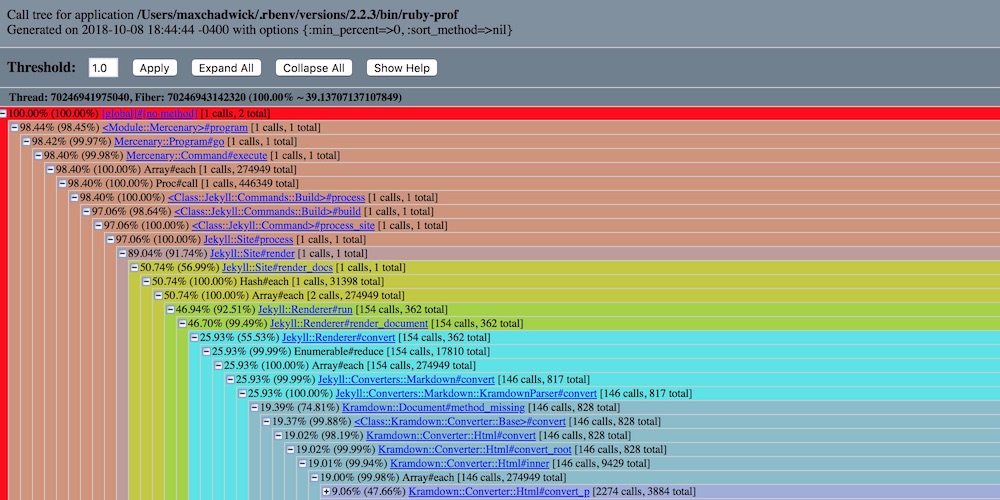
It provides output in HTML format that looks something like this

This has helped me get a decent handle on what’s actually taking so long when I run jekyll build.
 Hi, I'm Max!