Why Local Profiling Alone Is Insufficient For Performance Optimization
Published: January 3, 2017
When your goal is to make a web site load faster, the first logical step is to hook your local development environment up to a tool like XHProf, or Blackfire. This is definitely a good thing to do to get some sense of how the code is executing and where the bottlenecks are. However, if this is the only thing you do to review performance, there’s a good chance you’re going to miss something. Let me tell you what else is needed and why.
Production Traces FTW
To understand the bottlenecks in your code, it is critical that you capture traces of its execution in production. New Relic is a really awesome tool for this.
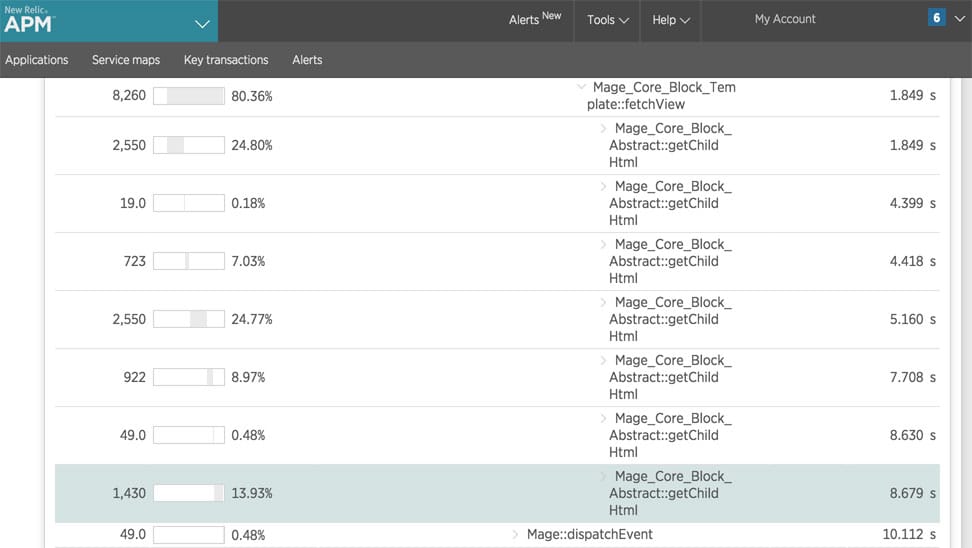
Reviewing production traces, will show you what’s really happening in production. If you are only reviewing local execution, there are a number of pitfalls…
Application State You Didn’t Think About
In local profiling there’s a good chance the happy paths are being followed. Using an ecommerce site as an example, you load a category page and then you view the execution. But did you think about how the category page will function if you have 30 products in your shopping cart? What about if those products have various types of promotions applied? How about on a category that has 50 different filter options? Did you select the view all option?
All these different variables can and will impact how your application performs.
Production traces will show you what is slow under real conditions. Local profiling is subject what the developer doing the performance optimization thought to test.
Production Data vs. Local Data
Another factor that can greatly impact the behavior of your application is the database, which typically will have some inconsistencies between local and production. I ran into a very real example of this today. The site had a “sitewide promotion” configuration area which was stored as a serialized string in the database. There were various configuration options such as coupon code, and url code to configure various “tiers”. It turned out that unserializing this data (which happened multiple times on each request) was causing performance issues. This would have been missed without reviewing a production trace as my local development environment did not have any configurations set for the “sitewide promotion”.
Other Configurations
In addition to database level differences, there are likely other subtle differences between your production environment and your local environment. Perhaps is a there is difference in your MySQL configuration. Or perhaps a bottleneck is actually related to DNS lookups in production - but your local has everything running on the same host. There are many things that can be different between your local and the production environment that may lead to misses when profiling locally.
Conclusion
I hope this post helped demonstrate why analyzing production traces is critical when aiming to achieve performance optimization. If you have any questions or comments, feel free to drop a note below, or, as always, you can reach me on Twitter as well.
 Hi, I'm Max!