Magento Cloud Response Times as measured by Fastly in New Relic
Published: December 29, 2020
Recently I’ve been dealing with a Magento performance issue that appears to been caused by Fastly (more on that in another post). Here I wanted to share a quick tip on how to view Fastly response times for Magento Cloud in New Relic.
Somewhat recently, Magento has begun leveraging New Relic logs to aggregate log data (an excellent addition to the platform!). The logs being aggregated include Fastly logs.
While your first instinct may be to click the “Logs” link in the top menu, I’ve generally found New Relic Insights NRQL searches to be much more powerful for analyzing log data.
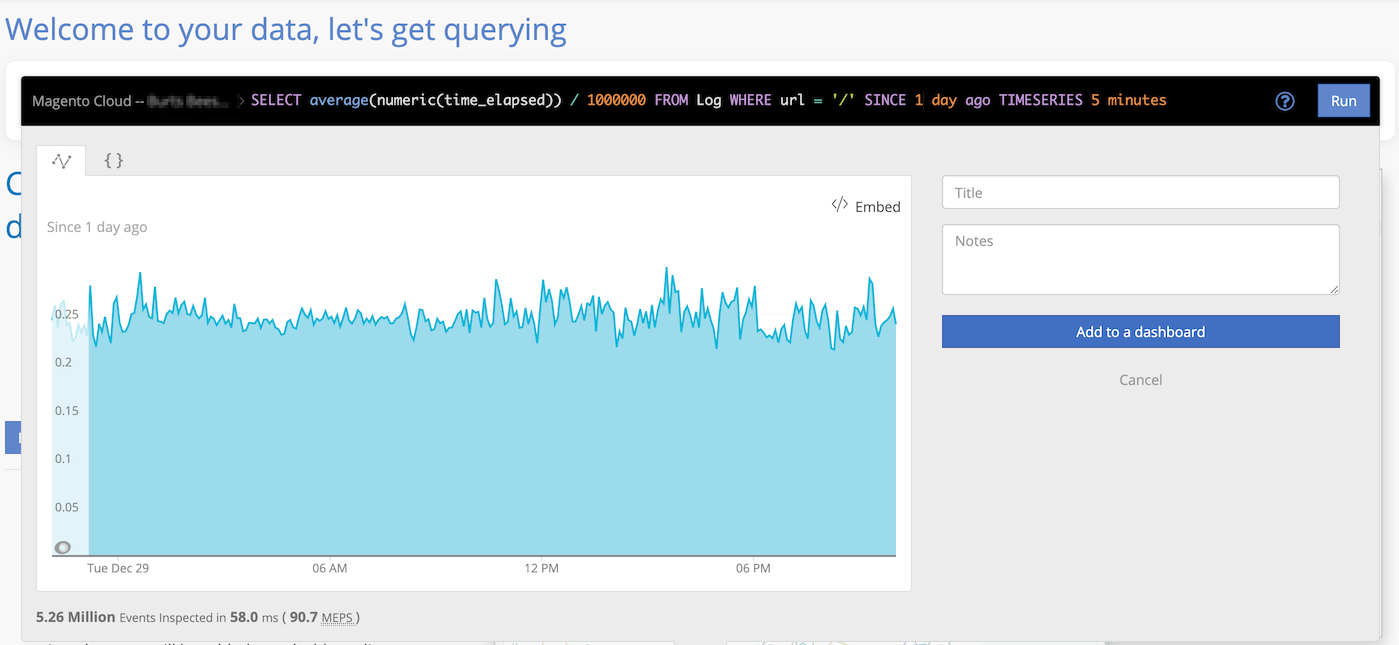
Here’s an example NRQL query to view average response times for the home page for the past day:
SELECT average(numeric(time_elapsed)) / 1000000 FROM Log WHERE url = '/' SINCE 1 day ago TIMESERIES 5 minutes
Here’s an example of the result

A few notes:
- We convert to
numericas Magento ships the data to New Relic as a string - We divide by 1 million as
time_elapsedis in microseconds -
TIMESERIES 5 minutesadds more precision to the graph…New Relic will otherwise show in 30 minute buckets
While in my case this was helpful for troubleshooting the performance issue this can also be helpful for getting a better picture of your site speed vs. New Relic APM as this data is inclusive of cached responses (which would otherwise not be included when just viewing APM data).
 Hi, I'm Max!