Magento Cloud Page Cache Hit Rate with New Relic Logs
Published: December 30, 2020
Way back in 2016, I spoke extensively about monitoring page cache hit rate in Magento. The content (and code) was based on the Magento 1 full page cache implementation. Now, four-and-a-half years later I wanted to give an update on the topic, discussing how we can now do this out of the box via New Relic logs for merchants running on Magento Cloud.
New Relic Logs
As discussed in my recent post Magento Cloud Response Times as measured by Fastly in New Relic Magento Cloud now sends Fastly logs to New Relic out of the box. These logs include the cache_status which will typically be either, HIT, MISS or PASS. While the it may be possible to retreive some data from the New Relic Log Search interface I find New Relic Insights, which supports NRQL queries to be much easier to use. Let’s take a look at some queries.
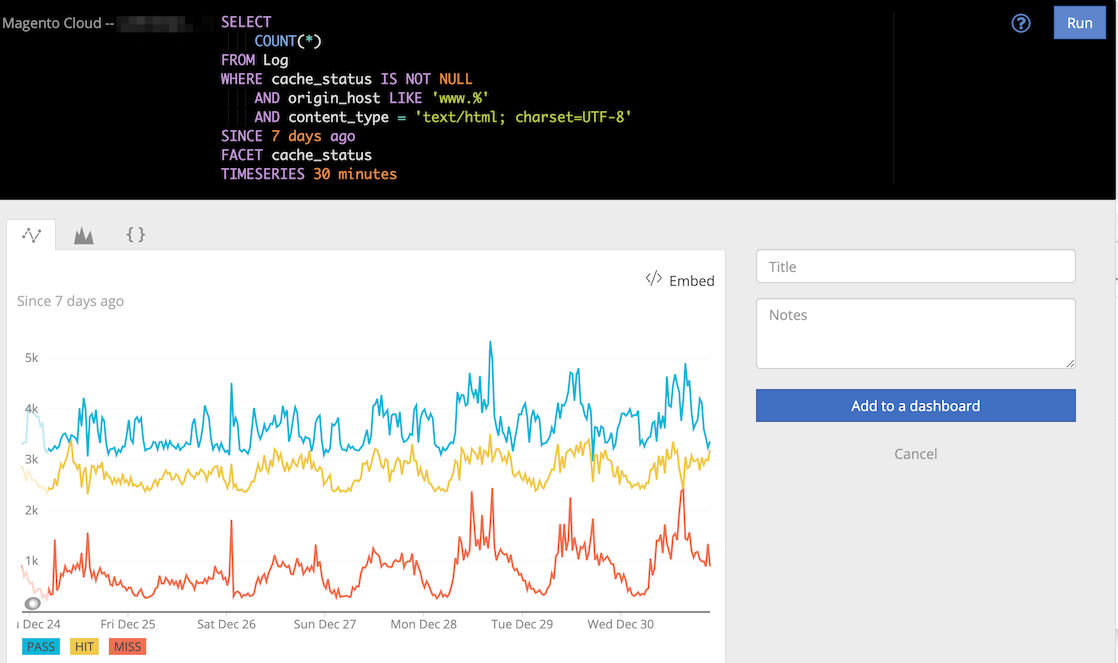
Global Hit Rate text/html on site
The below example query will help us visualize the cache hit rate for text/html URLs for the past 7 days.
SELECT
    COUNT(*)
FROM Log
WHERE cache_status IS NOT NULL
    AND origin_host LIKE 'www.%'
    AND content_type = 'text/html; charset=UTF-8'
SINCE 7 days ago
FACET cache_status
TIMESERIES 30 minutes
A few things to call out with this query
- We ensure
cache_statusis not null to limit theLogdata to only Fastly logs (other logs can also be queriedFROM Log) - We are filtering
origin_hostto only includewww.. This will filter out the staging environment for us, and also requests that are not to the www subdomain (e.g. redirected requests lacking www) - We add
30 minutesafterTIMESERIESto add more precision to the graph. New Relic will otherwise aggregate data into 6 hours buckets when requesting 7 days of data.
Here’s a preview of the graph:
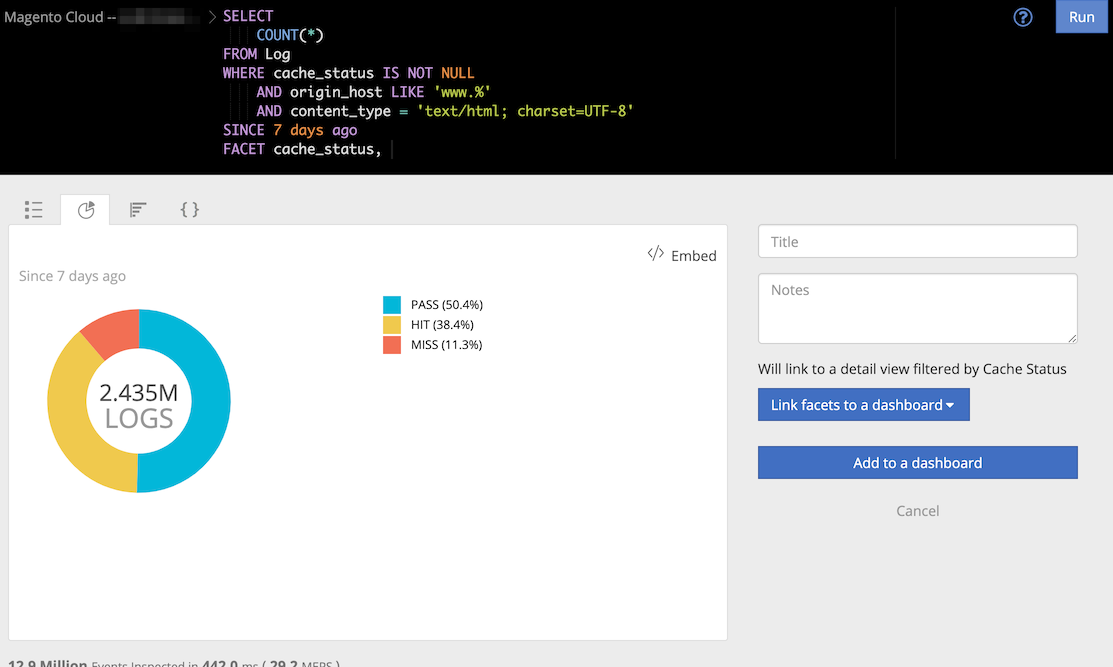
If we want to get the actual percent we’ll need to remove TIMESERIES from the query. We can then click into the pie chart.
By Route
While the global hit rate is interesting, on it’s own it not super actionable. For example, the checkout and cart page will never be cacheable. What’s more interesting it to know the hit rate by route (e.g. to see hit rate just for category pages, or product pages).
Unfortunately, Magento Cloud doesn’t currently support this. The implementation could be improved by Magento sending a response header containing the routing info, and updating the Fastly log format to additionally stream that to New Relic
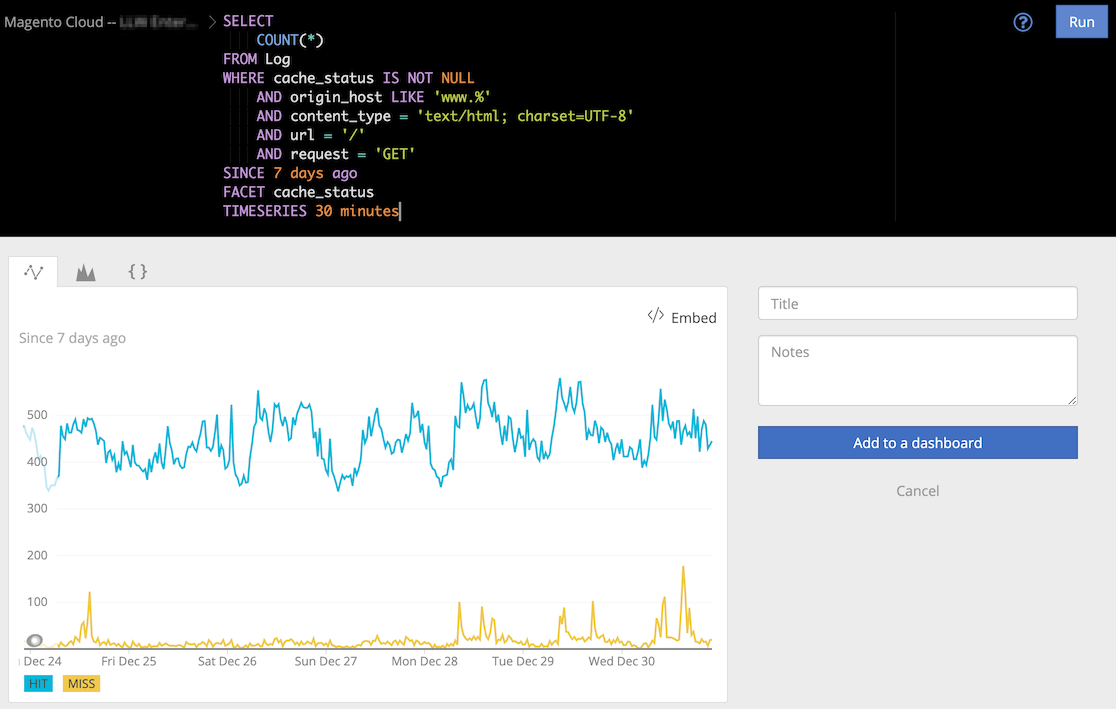
Currently out best option is to drill in to specific URLs.
For example, we can see the hit rate for the home page by adding WHERE url = '/' to the query. We’ll also filter for only GET requests as there can be POST requests to / which will return PASS (on the client in question these seem to come from user agent MacOutlook for some reason).
 Hi, I'm Max!