Tracking Paint Timing Metrics in Google Analytics
Published: May 15, 2020
I’ve recently started tracking Paint Metrics for this website in Google Analytics. I took a few missteps along the way. In this post I want to share my experience.
First Try
My initial implementation was based of code that has subsequently been removed from web.dev. It used Google Analytics’ User Timings feature to send the data. The code looked like this:
try {
  const observer = new PerformanceObserver((list) => {
    for (const entry of list.getEntries()) {
      ga('send', 'timing', {
        'timingCategory': 'Paint metrics',
        'timingVar': entry.name,
        'timingValue': Math.round(entry.startTime)
      });
    }
  });
  observer.observe({
    type: 'paint',
    buffered: true
  });
} catch (e) {
  // Do nothing if the browser doesn't support this API
}
Source: https://github.com/mpchadwick/mpchadwick.github.io/commit/a8a19b9b8c0262757ad8adca7e94e97b2e65e619
After collecting a bit of data I noticed that the average didn’t seem to match reality.
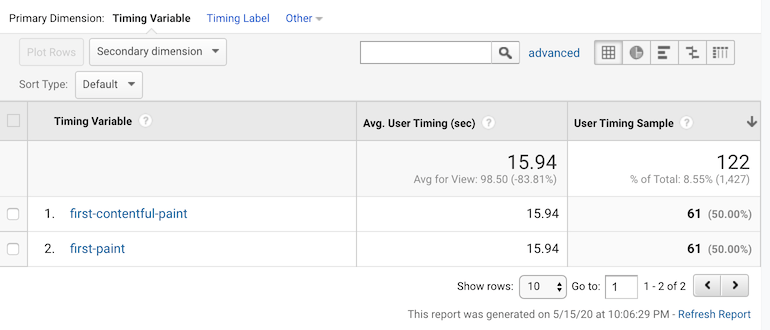
For the “average” user this site definitely doesn’t take 15.94 seconds to reach first paint…what could be going on?
Switching to the “Distribution” tab in Google Analytics provided an answer to this question.
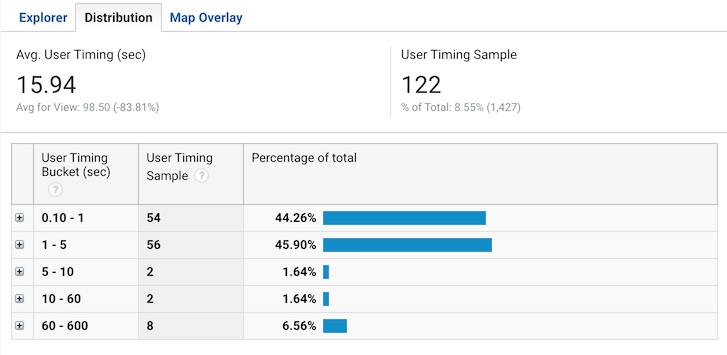
From the histogram we can see that the average number is being swayed by a small number of outliers where the value is extremely high (the 60 - 600 second bucket).
As it turns out, it’s much more useful to be able to look at histograms and percentiles for these metrics.
Step Two - Hit ID
At this point I started to do a bit of research into my options for accessing percentile data for Paint Metrics in Google Analytics beyond the Distribution tab histogram. While it’s possible to get an approximation of the median from the histogram in the Distribution tab, there is a better strategy outlined in Phillip Walton’s post “The Google Analytics Setup I Use on Every Site I Build”.
The idea is to use create a custom dimension (e.g. “Hit ID”) and set it to a unique value on each page load. It can then be used as a “Secondary Dimension” when viewing User Timing data, which allows you to separate out each individual timing value. From there you can get the exact median or other percentile values.
I borrowed some code from Phillip’s analyticsjs-boilerplate and implemented as follows:
const uuid = function b(a) {
  return a ? (a ^ Math.random() * 16 >> a / 4).toString(16) :
      ([1e7] + -1e3 + -4e3 + -8e3 + -1e11).replace(/[018]/g, b);
};

ga('set', 'dimension1', uuid());
Source: https://github.com/mpchadwick/mpchadwick.github.io/commit/7c023e470dc3995bdb50120eedac6fe0fdd6e6f0
With this change I could see each individual timing in Google Analytics:
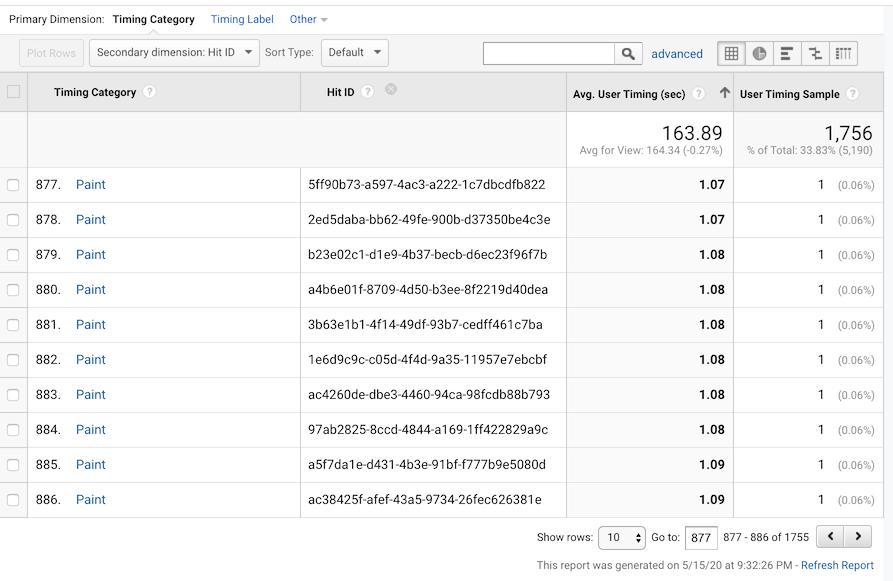
With 1755 values the 878th is the median meaning that for this metric (First Contentful Paint) is 1.08 seconds (despite the average being 163.89)
Learning About web-vitals
I was closely referencing web.dev’s metric’s guide while setting this up and at one point I noticed the JavaScript code snippet I had used was no longer published on the site and was replaced with a link to web-vitals. I clicked through on the link to learn more.
While it wasn’t immediately obvious what the benefits would be from switching from my current implementation to web-vitals I figured it was probably doing something better than I had been. Additionally, I noticed that the README recommended sending the data to Google Analytics as an Event rather than a User Timing.
Since web.dev is the authoritative source on the matter I decided to give this a shot.
I soon recognized several benefits with this approach compared to what I was doing previously:
More Accurate Data
The number of extremely high value anomalies has drastically decreased since switching to web-vitals. I believe this is due to the code in this commit which excludes paint metrics from “background page loads”.
Doesn’t Require Hit ID Custom Dimension
Sending the data to Google Analytics as an Event as recommended by web-vitals doesn’t require the Hit ID custom dimension as it sends a unique value in the Event Label.
The screenshot below demonstrates both of these benefits
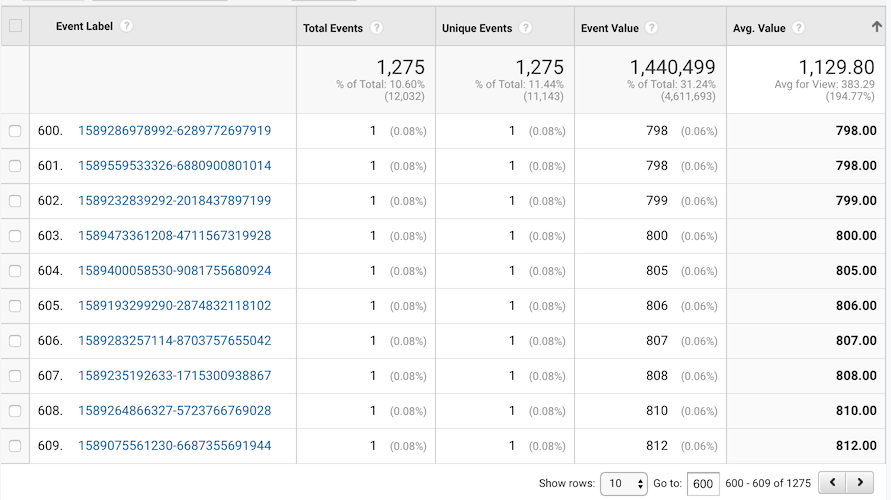
- Average for first contentful paint is now 1.1 seconds (values are in milliseconds)
- Median is 0.8s
- Each measurement can be viewed individually via Event Label
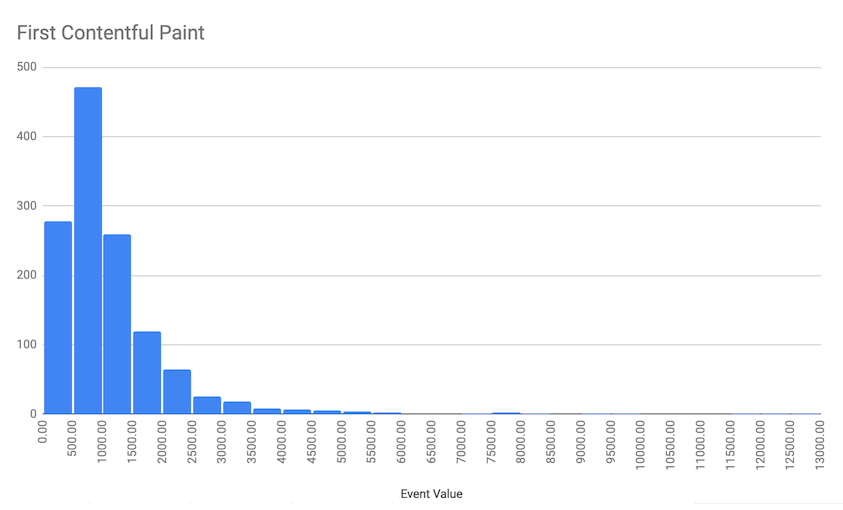
The only advantage I can see to using User Timings instead of Events is the histogram on the Distribution tab. However, in reality Google Analytics’ built in histogram is fairly limited and you’ll be better off exporting the data to visualize in Google Sheets or Excel where, amongst other things, you can control the bucket size.
 Hi, I'm Max!